Polynomial Graph
Instructions: Use this calculator for graphing polynomial functions, to create the graph of any polynomial function you provide in the form below:
Polynomial Graph
Use this calculator if you need help graphing a polynomial function. The process is easy: you just have to type the polynomial function you want to graph. You can write something like '3x^3 + x - 1', or you can preface it with the function name, like 'p(x) = 3x^3 + x - 1'.
The coefficients of the polynomial provided do not need to be integer necessarily, they can be fractions or any valid algebraic expression. The polynomial you provide may come simplified or not, it does not matter.
Then, once the polynomial has been provided, you can optionally determine the ranges of x values that will be graphed, and then you click on "Calculate", and shortly, all the steps of the process will be shown.
Polynomial functions are one of the most important objects you will find in Algebra as well as in Calculus. Also, polynomials lead to the need to solve polynomial equations, that have a whole lot of applications everywhere, in every aspect of life, even beyond Math.
Basics of polynomial functions
Let us recall that a polynomial function has the following form:
\[\displaystyle p(x) = a_0 + a_1 x + a_2 x^2 + .... + a_n x^n \]where we assume that \(a_n \ne 0\), and we say that the degree of the polynomial in this case is equal to \(n\), and the leading coefficient is \(a_n\). The layman way of defining the degree of a polynomial is that it corresponds to the highest power present in the polynomial expression.
For example, \(p(x) = 3x^2 + 2x - 1\) is a polynomial of degree 2, and its leading coefficient is 3. Now, \(p(x) = \sin(3x^2 + 2x - 1)\) is NOT a polynomial, for example.
How to do polynomials graphs?
Graphing polynomials in principle show the same as graphing any other function. If you were to do it by hand, you would tabulate several values for x and y, and you would trace a curve that more or less would pass through the points you are getting in your table.
Naturally, this method is a bit primitive, because in general we cannot know necessarily the full graph of a function by just knowing a bunch of points we are tabulating.
Fortunately, for polynomials the task is a bit easier, and in reality we can know a lot about its graph by knowing its leading coefficient and its degree.
Steps for graphing polynomial functions
The graph of a polynomial ultimately depends on the specific coefficient of every polynomial. But we can make some strong statements about the end behavior of a polynomials and the existence of real roots.
Let us recall that the end behavior of a polynomial is the behavior of the polynomial when x is very large and negative, and when x is very large and positive.
- Step 1: Identify the polynomial function, and simplify if you can, as it is easier to graph expressions that are simplified
- Step 2: Do you know the roots of the polynomial? If those are real roots, you know the points where the polynomial crosses the x-axis, which gives you a strong graphical reference
- Step 3: If the degree of the polynomial is odd, then the end behavior will be opposite for large negative x values and large positive x values. If the leading coefficient is positive, for large negative x values the polynomial will be very large and negative, and for large positive x values the polynomial will be very large and positive. If the leading coefficient is negative, for large negative x values the polynomial will be very large and positive, and for large positive x values the polynomial will be very large and negative
- Step 4: If the degree of the polynomial is even, then the end behavior will be the same for large negative x values and large positive x values. If the leading coefficient is positive, for large negative and positive x values the polynomial will be very large and positive. If the leading coefficient is negative, for large negative and positive x values the polynomial will be very large and negative
- Step 5: If the degree of the polynomial is odd, the polynomial will cross at least once the x-axis (so it has at least one real root), whereas that for an even degree, the polynomial won't necessarily cross the x-axis
- Step 6: A polynomial of degree n will cross the x-axis at most n times. For example, a polynomial of 4 degree 4 can cross the x-axis at most 4 times
So for example, a cubic polynomial can cross the x-axis at most 3 times, but it does not have to.
Graphing Calculator
What are the advantages of using a graphing calculator? Many. That is not to say that it is not a good skill to have that of being able to accurately sketch a polynomial using pen and paper.
\[\displaystyle \frac{a}{b} \times \frac{c}{d} = \displaystyle \frac{ac}{bd} \]- Advantage 1: You make sure you get an accurate depiction of the actual graph of the polynomial
- Advantage 2: You can use it to check your own work, to make sure if you were following the right steps
- Advantage 3: A good calculator with choose an appropriate window to show the most relevant aspects of the graph
A good graph can tell you a lot of about the properties of a function, and the same goes for a polynomial. Graphing polynomials can help you truly visualize what type of roots the polynomial have.
Tips and Tricks
Be careful with over-reading into what you see in a polynomial graph. You cannot readily tell much about roots with multiplicity, so nothing replaces the actual function.
If you want to try other types of functions, try this function graph tool.
Example: Graphing polynomial functions
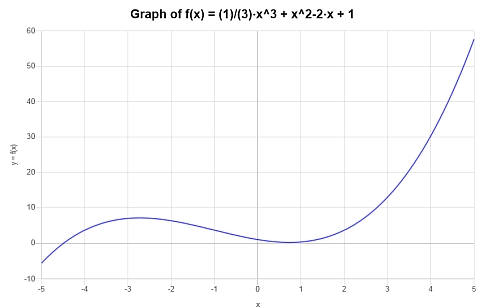
Graph the following polynomial: \(p(x) = \frac{1}{3} x^3 + x^2- 2x +1 \)
Solution: We are provided with the following polynomial expression that we need to calculate: \(\displaystyle \frac{1}{3} x^3 + x^2- 2x +1\).
The provided expression is irreducible, so there is nothing to simplify.
The following plot is obtained for the given polynomial expression on the interval \([-5, 5]\):
Example: Polynomial Graph
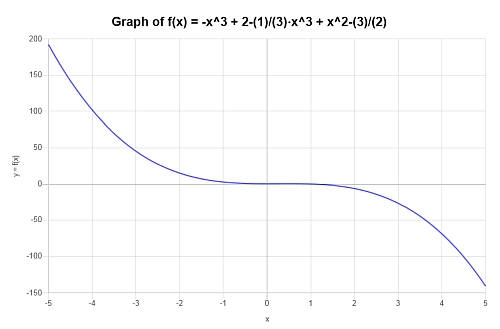
Simplify and graph: \(p(x) = x^4 - x^3 + 2 - \frac{1}{3}x^3 + x^2 - \frac{3}{2}\)
Solution: Now, we need to work with: \(\displaystyle -x^3+2-\frac{1}{3}x^3+x^2-\frac{3}{2}\).
The following simplification is obtained:
which concludes the process of polynomial simplification.
So then, the following plot is obtained for \(\displaystyle -\frac{4}{3}x^3+x^2+\frac{1}{2}\) on the interval \([-5, 5]\):
Example: More polynomial graphs
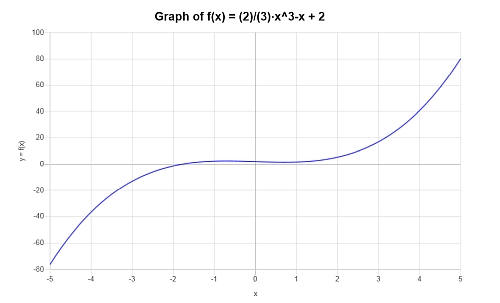
Find the graph of the following polynomial \( p(x) = \frac{2}{3} x^3 - x +2 \).
Solution: For this example, the provided polynomial is: \(\displaystyle \frac{2}{3} x^3 - x +2 \).
In this case, the provided expression is irreducible, so there is nothing to simplify.
The following plot is obtained for the given polynomial expression on the interval \([-5, 5]\):
More polynomial calculators
Graphing polynomials is extremely useful as it shows us the main characteristics of their behavior around their roots and their end behavior. Graphing usually goes hand in hand with identifying approximately where roots could be, which could use with factoring polynomials as well.
Although we can know a lot about the polynomial just from graphing it, we still need to go through the process of attempting to find rational roots , as the starting point for solving polynomial equations with degree higher than 2 (this, that are not quadratic equations ).
Systematically guessing or finding rational roots, paired with using long division or synthetic division so to use the factor theorem may lead to a successful search of polynomial roots , but such approach does not always work, and often times you need to rely on the calculator to find numerical approximations.
Related Calculators
 Exponential Function Graph maker
 Algebraic Expression Calculator
 Combinatorial Coefficient Calculator
 Exponential Function Calculator
Polynomial Operations Calculator
Exponential Function Calculator
Polynomial Operations Calculator
 Fraction Reduction to Lowest Terms
 Feet to Miles Conversion - Step by Step Calculator - Mathcracker.com
 Geometric Mean Calculator
 Trigonometric Function Grapher
 Percentage Calculator
 Trigonometric Expression Evaluator