Trigonometric Function Grapher
Instructions: Use this Trigonometric Function Grapher to obtain the graph of any trigonometric function and different parameters like period, frequency, amplitude, phase shift and vertical shift when applicable:
Trigonometric Function Grapher
Trigonometric functions have the property that they repeat their behavior. This is, they are periodic. Mathematically, that means that there is a number \(P\) with the property that
\[f(x+P) = f(x)\]for all values of \(x\). That number \(P\) is called the period . All this is saying is that the behavior of the function repeats itself in trig graphs every \(P\) units in the x-axis.
Observe that all the trigonometric functions you provide for this calculator, the argument \(x\) is assumed to be measured in radians .
Example of periodic functions
For example, for the case of the sine function, \(f(x) = \sin x\), the graph is shown below:
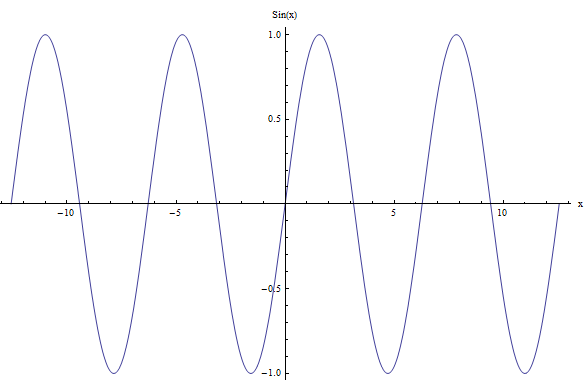
You can see that the behavior of the function repeats itself. Indeed, you can take any interval of length \(2\pi\) and the next interval of length \(2\pi\) will be identical to the previous one, in terms of the shape of the function.
Why does this happen? Because \(\sin(x + 2\pi) = \sin(x)\), for all \(x\), and then the function is periodic. For a simplification with steps, you can use this sin calculator .
What can I graph with this Trigonometric Function plotter?
You can plot any trigonometric function. The most common use is for graphing sine and cosine, but you can use it for any trig function.
You will see that periodic functions can be made to be more complex by compounding them with other algebraic expressions.
For example, what is the behavior of the function \(f(x) = 3\sin(2x+1)-4\) Well, it is even periodic? Yes, you bet. The behavior of the function \(f(x) = 3\sin(2x+1)-4\) is in all ways similar to that of the function \(f(x) = \sin x\).
This trigonometric function grapher will help you find the graph and the specific characteristics (period, frequency, amplitude, phase shift and vertical shift) of more complex trigonometric functions, such as \(f(x) = 3\cos(\pi(x-2)+3)-\frac{\pi}{4}\)
Do parentheses matter?
The short answer is: IT DEPENDS. Sometimes you will have a simple expression where only sums, or only multiplications are present, in which case the associative property can be used. But when there are mixed operations very frequently you cannot omit or change a parenthesis without breaking the function or changing it.
Graph calculators
This grapher only deals with trigonometric functions. In order to graph other functions , you can use our general function plotter , which will take any function, not only trigonometric ones.
Example of trig graph
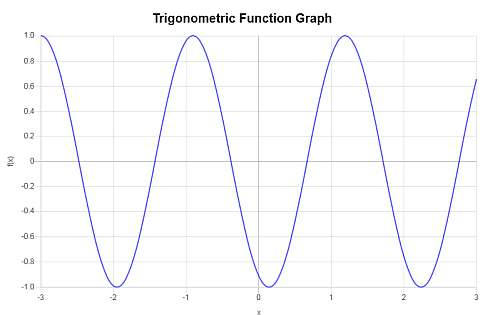
Question : Consider the function \(f(x) = \sin(3x-2)\). Find the period, frequency, amplitude and phase shift. Also, provide a graph of the function.
Solution:
The following function has been provided:
\[f(x) = \sin\left(3x-2\right)\]Based on the argument of the trigonometric function that was passed, the frequency and the period are computed as follows:
\[ \begin{array}{ccl} \text{Period} & = & \displaystyle\frac{2\pi}{3} \\\\ \\\\ & \approx & 2.0944 \end{array}\]and also
\[ \begin{array}{ccl} \text{Frequency} & = & \displaystyle\frac{3}{2\pi} \\\\ \\\\ & \approx & 0.4775 \end{array}\]Based on the provided trigonometric function, \(f(x) = \sin\left(3x-2\right)\), we obtain that:
• The amplitude in this case is \(A = 1\).
• The phase shift is equal to \(\displaystyle\frac{2}{3} = 0.6667\).
• The vertical shift is equal to \( 0\).
![]() Summarizing, the following has been found for the given
trigonometric function
Summarizing, the following has been found for the given
trigonometric function
- Period = \(2.0944\)
- Frequency = \(0.4775\)
- Amplitude = \(1\)
- Phase Shift = \(0.6667\)
- Vertical Shift = \(\displaystyle 0\)
Based on the above information, the following graph is obtained: