Quartile Calculator
Instructions: This quartile calculator will calculate a quartile you specify, showing step-by-step calculations, for a sample data set you specify in the form below:
More About this Quartile Calculator
The k-th quartile (first, second or third quartile) of a distribution corresponds to a point with the property that 25% of the distribution is to the left of the first quartile (\(Q_1\)), 50% of the distribution is to the left of the second quartile (\(Q_2\)) and 75% of the distribution is to the left of the third quartile (\(Q_3\))
How to Compute a Quartile?
In the case of sample data, which means that you DON'T HAVE all the values of the population, you only have a sample, the quartiles can be only estimated.
In order to do so, the sample data is first organized in ascending order. Then, the position of the k-th quartile \(Q_k\) is computed using the formula:
\[ L_k = \frac{(n+1) k}{4} \]where \(n\) is the sample size, and \(k\) is the corresponding order of the quartile (\(k\) = 1, 2 or 3).
• If \(L_k\) is an integer number, then the quartile \(Q_k\) is the value located in the position \(L_k\) of the data organized in ascending order.
• If \(L_k\) is NOT integer number, then we need to find the two closest integer positions \(L_{low}\) and \(L_{high}\) so that \(L_{low} < L_k < L_{high}\). For example, if \(L_P = 5.25\), then \(L_{low} = 5\) and \(L_{high} = 6\).
Then, after we have found \(L_{low}\) and \(L_{high}\) we locate the values in the ascending array in positions \(L_{low}\) and \(L_{high}\), and we call them \(Q_{low}\) and \(Q_{high}\) respectively, and we estimate (interpolate) the quartile \(Q_k\) as:
\[ Q_k = Q_{low} + (L_k -L_{low})\times(Q_{high} - Q_{low}) \]How to use Quartiles
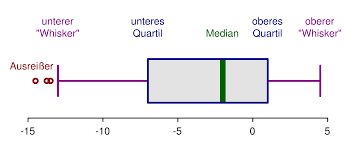
Quartiles are super practical as they allow you to aid with the construction of the 5-number summary and the calculation of box plots. .
Also, the difference between the third and first quartile, also known as the Interquartile Range (IQR), has a neat property that it contains 50% of the data. Also, the IQR plays a role as a measure of dispersion for ordinal data (for scale data you can use this standard deviation calculator to get a measure of dispersion)
Quartile calculator excel
Some confusion occurs when people uses Excel to compute quartiles using the formula "=QUARTILE(data, k)", because the above formula does not always coincide with the result given by Excel. So what is going on? What happens is that Excel uses an oversimplified form of interpolating when the percentile position is not exact.
The interpolation formula above is more precise than what Excel uses, but yet, linear interpolation is one possible approximation.
Actually, different statistical programs use different ways of computing quartiles. For example, Excel spits out a different value than Mintab or SPSS do. Indeed, SPSS and Minitab use the interpolation formula shown above.
Why should I use this calculator instead of a statistical software?
You can use a statistical software if you want, but this quartile calculator shows work, making clear all steps required.
Looking for something else than quartiles? Percentiles perhaps?
If instead of computing quartiles you need a general percentile, you can use this percentile calculator . Let us recall that the first quartile corresponds to the 25th percentile, and the third quartile corresponds to the 75th percentile.
Another type of special percentile calculator is our decile calculator , which is specific for deciles.
Example: Calculation of of day's sale in inventory
Question : Suppose you are given sample data as follow: 2, 10, 12, 1, 2, 3, 10, 1, 3, 4, 6, 7, 8, 9, 24, 23, 2, 3, 3, 3, 3, 4, 5. Compute the first quartile by hand, using interpolation.
Solution:
These are the sample data that have been provided:
| Observation: | \(X\) |
| 1 | 2 |
| 2 | 10 |
| 3 | 12 |
| 4 | 1 |
| 5 | 2 |
| 6 | 3 |
| 7 | 10 |
| 8 | 1 |
| 9 | 3 |
| 10 | 4 |
| 11 | 6 |
| 12 | 7 |
| 13 | 8 |
| 14 | 9 |
| 15 | 24 |
| 16 | 23 |
| 17 | 2 |
| 18 | 3 |
| 19 | 3 |
| 20 | 3 |
| 21 | 3 |
| 22 | 4 |
| 23 | 5 |
We need to compute the first quartile (\(Q_1\)) based on the data provided.
In order to compute the requested quartile, the data needs to be put into ascending order, as shown in the table below
| Position | X (Asc. Order) |
| 1 | 1 |
| 2 | 1 |
| 3 | 2 |
| 4 | 2 |
| 5 | 2 |
| 6 | 3 |
| 7 | 3 |
| 8 | 3 |
| 9 | 3 |
| 10 | 3 |
| 11 | 3 |
| 12 | 4 |
| 13 | 4 |
| 14 | 5 |
| 15 | 6 |
| 16 | 7 |
| 17 | 8 |
| 18 | 9 |
| 19 | 10 |
| 20 | 10 |
| 21 | 12 |
| 22 | 23 |
| 23 | 24 |
The next step is to compute the position (or rank) of the first quartile. The following is obtained:
\[ \text{Quartile Position } = \frac{(n+1)P}{100} = \frac{(23+1)\times 0.25}{100} = 6 \]Since the position found is integer, the first quartile corresponds to the value in the position 6 th in the data organized in ascending order.
So then looking at the table we find directly that the first quartile is 3.
This completes the calculation and we conclude that the first quartile is equal to \(Q_1 = 3\).


