Here you have a list of all the graphing tools we have available at our site. Please do not hesitate to contact us if there is any grapher that you would like to see implemented here.
Most of provided graphers are related to the graphical depiction of probability distributions and probability events, but we also have graphing tools for making the graph of exponential, trigonometric and any kind of function.
You can search for the grapher you are looking for in the search box below, or scroll down the list of tools shown below.
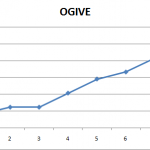
Ogive Graph Maker
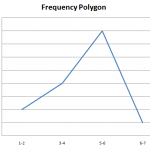
Frequency Polygon Graph Maker
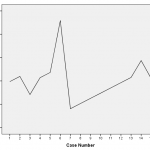
Residual Plot Grapher
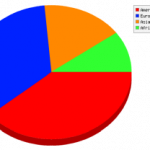
Pie Graph Maker for Sample Data
Relative Frequency Graph Maker
Frequency Table Calculator
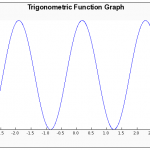
Trigonometric Function Grapher
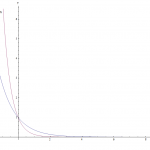
Exponential Function Graph maker
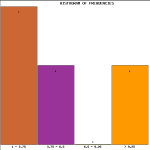
Pareto Chart Maker
Normal Probability Plot Maker
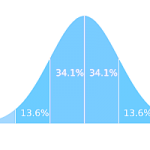
Normal Probability Grapher
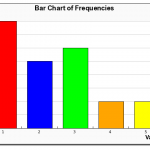
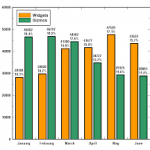
Bar Chart Maker
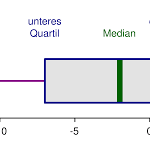
Box Plot Maker

Function Grapher Online
Histogram Maker
Line Chart Maker
Pie Chart Maker
Scatter Plot Maker

Stem-and-Leaf Plot Maker
Time Series Plot
Related Posts:
-
 Free Math Help Resources
-
Exponential Decay Formula
-
Box and Whisker Plot
-
The Graph of a Function
-
Trigonometric Function Grapher
-
How to Find the Inverse of a Function
-
Exponential Function Graph maker
-
Finding the Log Graph


In case you have any suggestion, or if you would like to report a broken solver/calculator, please do not hesitate to contact us .