Normal Probability Calculator
Instructions: This Normal Probability Calculator will compute normal distribution probabilities using the form below, and it also can be used as a normal distribution graph generator. Please type the population mean and population standard deviation, and provide details about the event you want to compute the probability for (for the standard normal distribution, the mean is 0 and the standard deviation is 1):
More About this Normal Distribution Probability Calculator Tool
Here are some facts about the normal distribution probability so you can better understand this normal distribution graph generator. First of all, the normal probability is a type o f continuous probability distribution that can take random values on the whole real line. The main properties of the normal distribution are:
- It is continuous (and as a consequence, the probability of getting any single, specific outcome is zero)
- It has a "bell shaped" distribution (and that is where the "Bell-Curve" name comes along)
- The normal distribution is determined by two parameters: the population mean and population standard deviation
- It is symmetric with respect to its mean
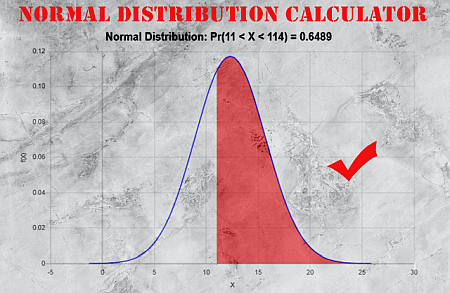
Using the above normal distribution curve calculator , we are able to compute probabilities of the form \(\Pr(a \le X \le b)\), along with its respective normal distribution graphs . This not exactly a normal probability density calculator , but it is a normal distribution (cumulative) calculator. Change the parameters for a and b to graph normal distribution based on your calculation needs. If you need to compute \(\Pr(3 \le X \le 4)\), you will type "3" and "4" in the corresponding boxes of the script.
One very important special case consists of the case of the standard normal distribution , which corresponds to the case of a normal distribution with mean equal to \(\mu = 0\), and standard deviation equal to \(\sigma = 1\). In the cases of a regular normal distribution or of a standard normal distribution can all be handled with the above probability calculator.
Parameters of the Normal Distribution
Therefore, don't forget, the normal distribution is in general determined by its mean and standard deviation. The mean can be any real number and the standard deviation can be any non-negative number.
But in particular, the standard normal distribution is a normal distribution that has the property that the mean of the standard normal distribution is zero and the standard deviation of the standard normal distribution is 1.
Please do not hesitate to contact us if you have any question about this normal distribution graph generator.
Link with the normal distribution and the normal cdf
The normal cdf is short for normal cumulative distribution function, which for a given value of \(z\), it provides the total probability up to the value of the given value \(z\).
You can use this normalcdf calculator to compute the cumulative probability you desire, and it the same as using this normal distribution calculator with lower limit \(-\infty\) and upper limit \(z\).
The Normal Distribution and the Z-scores
In many aspects, you can see a normal distribution calculator as a z score probability calculator , because of the way we compute normal probabilities in general.
Indeed, when you have a general normal distribution with mean \(\mu\) and \(\sigma\) as the distribution of X, and you want to compute \(P(a \le X\le b)\), then you actually use z-scores:
\[P(a \le X\le b) = Pr\left(\frac{a-\mu}{\sigma} \le \frac{X-\mu}{\sigma} \le \frac{b-\mu}{\sigma} \right)\] \[ = Pr\left(z_a \le Z \le z_b \right)\]So in other words, instead of compute the probability that X is between a and b, what you do is to compute the corresponding z-scores of a and b, and you call them \(z_a\) and \(z_b\) and you compute the probability that Z (a variable with a standard normal distribution) is between \(z_a\) and \(z_b\).
Other normal distribution calculator
The normal distribution is a crucial continuous distribution. Aside from this probability distribution calculator for normal distributions, you can use the 68-95-99 rule calculator , which shows how to use the of empirical rule.
A less powerful, but yet more general result similar to the empirical rule is that of Chebyshev's inequality , which finds a reasonable estimate for the probability that an outcome is within a certain number of standard deviations from the mean.
Also, frequently you are interested in the behavior of sample sizes, for which you can use our sampling distribution calculator , where you are taking the average of samples of size \(n\)
Other continuous distributions
For other type of continuous distributions, you can try for example.our site provides many other continuous distribution calculators such as the exponential distribution calculator . F uniform distribution calculator .
Related Calculators
 Descriptive Statistics Calculator of Grouped Data
 Confidence Interval for the Difference Between Proportions Calculator
 Inverse Cumulative Normal Probability Calculator
 Standard Normal Distribution Probability Calculator
 Normal Probability Calculator for Sampling Distributions
 F Distribution Calculator
 Uniform Probability Calculator