Frequency Table Calculator
Instructions: Use this Frequency Table Calculator to construct a frequency table associated with the sample provided in the form below.
Type (or paste from Excel) the sample values you want to analyze
Frequency Table Calculator
A frequency table corresponds to an organized table that contains the different values that are in the sample along with the frequencies of those values (how many times each value appears in the sample).
In other words, it is a way of tallying up the sample data you have available.
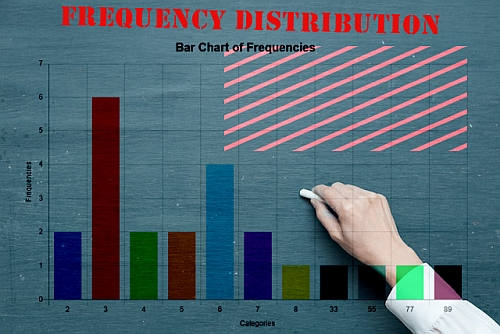
Typically, a frequency table can be represented by a bar chart (a frequency bar chart) to get a clear depiction of the distribution of the variable, although the most common tool to assess the distribution of sample data is the construction of an histogram .
With this calculator all you need to do is to just type or paste the data from Excel and then click on "Calculate" to get all the steps shown.
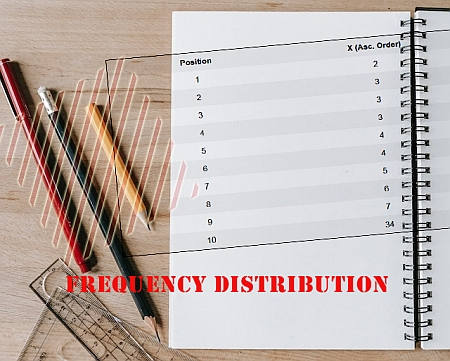
Frequency distribution table
This calculator will create a frequency distribution table by grouping and tallying up the number of times a number appears in the sample data provided.
Once this frequency distribution is constructed, depending on whether or not you checked the option for it, you will also see the construction of the relative and cumulative frequencies, which also provide a perspective on the distributional properties of the sample provided.
Then, once the tables are shown and explained, you will see a bar chart depicting the situation graphically. Of course, you can construct a full-fledged histogram , to get a more clear graphical depiction.
Relative Frequency Table
Often times, it is useful to express the frequencies to normalize them and get what proportion (percentage) of the frequencies are associated to each values. Such relative frequencies can also be graphed and represented with a bar chart ( relative frequency bar chart ).
One thing to be observed is that when looking at the shape of the bars in a regular frequency chart, the same shape will be obtained in the relative frequency bar chart, only the scale on the Y-axis changes.
Cumulative Frequency Table
Also, it is useful to construct the cumulative frequencies to see how much is accumulated (in terms of cumulative frequencies) with respect to the total number of frequencies.
Observe that for working with classes instead, you can use this histogram maker which would a better work instead.


