Finding the Log Graph
The way of finding the log graph is common to all logarithmic function. This is because all logarithmic function have essentially the same shape, at least structurally, it only depends on the base of the logarithm.
In other words, the way you would go about finding the graph for a natural logarithmic function (ln) will be the same way you would use to graph the base 10 logarithmic function (log).
Graphing a log function without a calculator is not that hard, and in fact, it is relatively easy to do if you know some basic properties of the logarithmic functions.

How do you find the equation of a log graph?
First, let us recall the logarithmic function with base \(a\), \(\log_a x\). The most typical bases used are for \(a = 10\), in which case we write simply \(\log x\), and the case where \(a = e\), in which case we write \(\ln x\), and we call it the natural log.
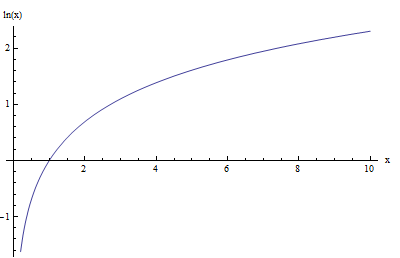
For example, the graph of the natural log function, \(\ln x\) is shown below:
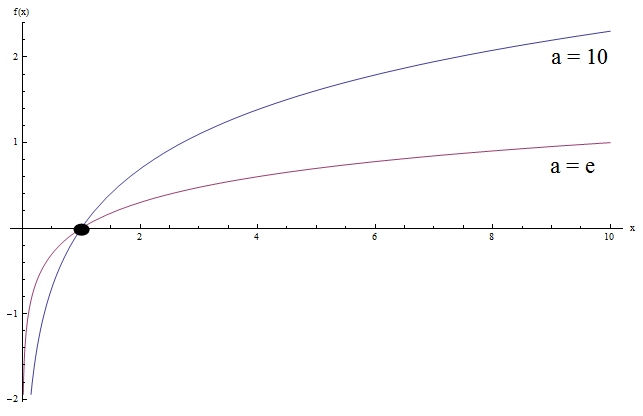
Now, let us see what happens when we graph together \(\log x\) and \(\ln x\) (this is the log base 10 and the natural log):
How logs with different bases look like on a graph?
Do you see any similarities in the log functions above? Well, there are some.
Notice that both graphs have the same general concave shape. Also, both graphs cross the y-axis at \(x = 1\) (which is not a surprise since \(\log_a 1 = 0\) for all bases, with \(a > 0\)).
Another thing is that both graphs approach to negative infinity when \(x\) approaches to 0, and to infinity as \(x\) approaches to infinity.
What if we try to graph logarithmic functions with \(0 < a < 1\)?. Check the example below:
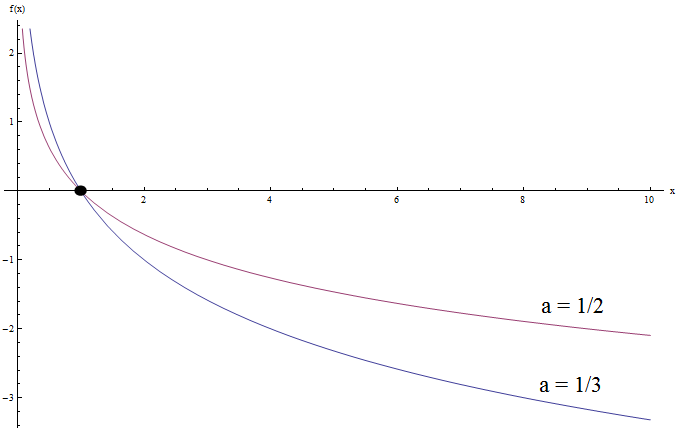
Do you see any similarities now? Of course.
Notice that both graphs have the same general convex shape. Also, both graphs again cross the y-axis at \(x = 1\), which is expected.
But now both graphs approach to infinity when \(x\) approaches to 0, and to negative infinity as \(x\) approaches to infinity. It is kind of the opposite behavior as when the base \(a\) is greater than 1.
How to do logs on a graph?
The way of doing logs on graph depends on some factors. Say you are in a Physics lab 101 class, they may want to use these papers that have a logarithmic scale on the y-axis, so that the log graph looks linear.
That probably makes sense in physics, but it is not really necessary when you are working in Algebra or Calculus, where we have no issues with putting the logs just like the are on a graph.
Usually you will work with a computer algebra system (CAS) such as Mathematica or Matlab, or you will work on paper whenever you want to graph a log function, or you can use our function graph calculator , which will even simplify the function before graphing it.
How Do You Make a Log Graph?
The question should be instead: How do you graph logs without a calculator? The distinction is important, because with a calculator it is a simple as inputting the log function into the calc, and then you get the graph.
Which leaves us with the situation of graphing the log in case we don't have a calculator. Based on what we found in the previous examples, we can throw in some rules you can you use for when you want to make log graphs:
Assume you want to graph the function \(y = \log_a x\), for \(a > 0\). Then:
![]() Step 1
: ALWAYS, the logarithmic function crosses the y-axis at \(x = 1\).
Step 1
: ALWAYS, the logarithmic function crosses the y-axis at \(x = 1\).
![]() Step 2
: If \(a > 1\), then the graph is increasing and concave. Also:
Step 2
: If \(a > 1\), then the graph is increasing and concave. Also:
![]() Step 3
: If \(0 < a < 1\), then the graph is decreasing and convex. Also:
Step 3
: If \(0 < a < 1\), then the graph is decreasing and convex. Also:
Easy, right??
More About Log Graphs
First of all, knowing how to graph a function is a crucial skill, considering that the graph of a function gives you a LOT of information about it.
In the previous sections we learned how the base of a log affects the graph. The interesting thing is that the shape and behavior of the logarithmic graph depends only on whether \(a > 1\) and \(0 < a < 1\).
Can a log equal a negative number?
Well, we need to specify what we mean by that. First, the base of the logarithmic function cannot be negative. Also, the argument of a logarithmic function cannot be negative either.
BUT, the logarithm of a number can absolutely be negative. For example: \(\ln(1/e) = -1\).
How do you graph inverse log functions?
Well, the first thing you need to know is that the inverse of a log function will always be an exponential function.
So then, the graphing the inverse of a log function is as easy as knowing what is the corresponding exponential and graphing it.
There are other methods too. You can draw the original log graph, and draw a graph that is symmetric to this given log graph, with respect to the 45 o straight line \(y = x\).
Or, use the original graph and change the value of \(x\) by the value of \(y\).
This tutorial is oriented towards the graphical properties of the logarithmic function. For the definition and basic log rules, check this one .
What is the log function formula?
The most notorious log function formulas are those that express the basic properties of the logarithmic function. These log function formulas are, for b > 0:
1) \(\log_b\left(1\right) = 0\)
2) \(\log_b\left(b^x\right) = x\)
3) \(\log_b\left(x \cdot y \right) = \log_b\left(x \right) \cdot \log_b\left( y \right)\)
4) \(\log_b\left(a^x\right) = x \log_b\left(a \right)\)
5) \(\log_b\left(\frac{x}{y} \right) = \log_b\left(x \right) - \log_b\left( y \right)\)