The Graph of a Function
The graph of a function is a set of ordered pairs \((x,y)\). Or, the graph of a function is a conceptualization we do a set of pairs \((x,y)\) on a coordinate system. I say it is a conceptualization, because the way we represent a graph is to a degree an optical illusion.
Why do I say that? Well, take a look. What do you think of when I say "graph". Check the figure before.
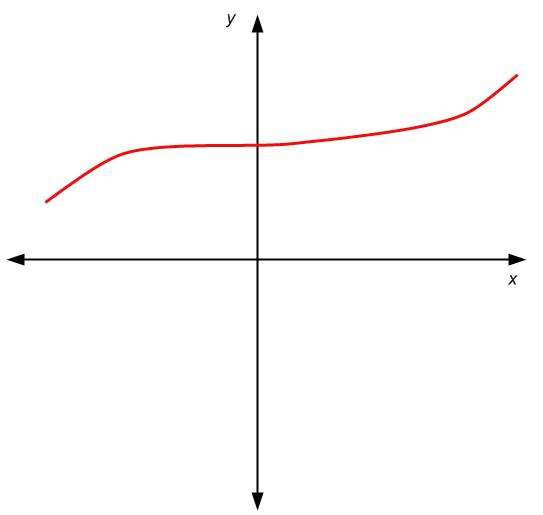
So that is a graph. A set of \((x, y)\) pairs, or as we can also call them, points. A specific point is highlighted below, take a look
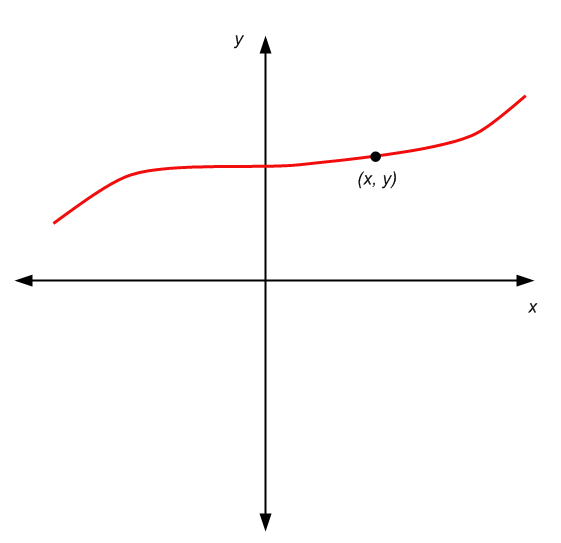
The trick, or the visual illusion, is that that a point has, in theory, no dimensions (no width, no length). So this "curve" we draw to represent a graph, it is kind of a convenient way of representing a graph, but we are kind of cheating, because this representation has a curve that has a thickness.
So, this is not to rain on your parade, it is just to make it clear that what you understand as a graph, it is rather a representation of a graph that is convenient and credible.
Graphs associated with functions
One really easy way to define a graph is by using a function \(f(x)\). Indeed, a graph defined by a function \(f(x)\) is the set of all the points \((x, f(x))\), for \(x \in D\), where \(D\) is the domain of the function \(f\).
The representation is the same as the previous graphs, only that now we do the following:
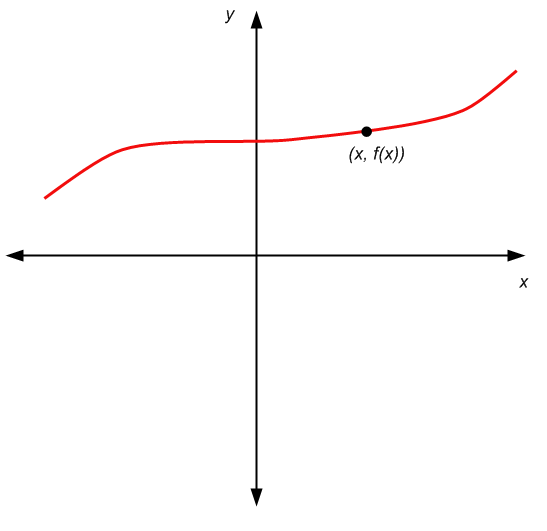
In this case, the most clear difference is that the second component of the pair \((x,y)\) is not just any value \(y\). The second component is \(f(x)\), so it is uniquely determined by \(x\).
.EXAMPLE 1
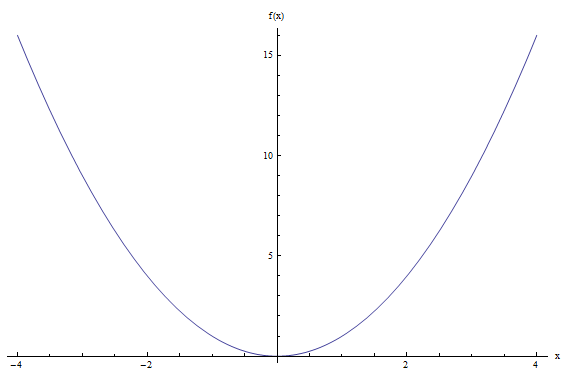
Plot the graph of the function \(f(x) = x^2\).
ANSWER:
Nothing strange, we just need to draw the graph of a function . The points in the graph are of the form \((x, f(x)) = (x, x^2)\). This is, the value of \(x\) is associated with \(x^2\) on the graph.
Examples of points that are on the graph: \((1, 1)\), \((2, 2^2) = (2, 4)\), \((3, 3^2) = (3, 9)\), etc. Graphically we get the following representation of the graph:
Continuous versus Discontinuous Graphs
One of the assumptions that we make in our minds when we think of a graph is that is smooth, without any jumps. That is not always the case. There are functions that lead to functions that jump, or even lead to be strange graphs. Other functions have graphs that are very smooth, like it happened with \(f(x) = x^2\).
The concept of the smoothness of a function is formally dealt with in Calculus, with the notion of continuous function. But without much of a fuzz, we can say that, for now, we will think that a continuous function is a function that has a "smooth" graph, and a discontinuous function is a function that is not smooth, or it has "jumps".
EXAMPLE 2
Is the function \(f(x) = sin(x)\) continuous?
ANSWER:
Well, again, we would need formal continuity analysis to check. But in light with the informal definition given above, let us check its graph. The computer gives us the following:
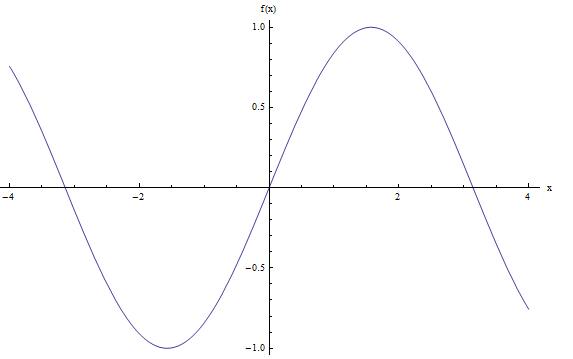
I would say that the graph above looks very smooth, without any jumps, so using our naive definition, I would say that \(f(x) = \sin x\) is continuous.
EXAMPLE 3
Is the function \( f\left( x \right)=\left\{ \begin{array}{cc}-1 &\,\,\,\,\text{for } x\le 1 \\ \\ x & \,\,\,\,\,\,\text{for }x>1 \\ \end{array} \right.\) continuous?
ANSWER:
In order to answer the question, we need to plot the graph. The computer gives us the following:
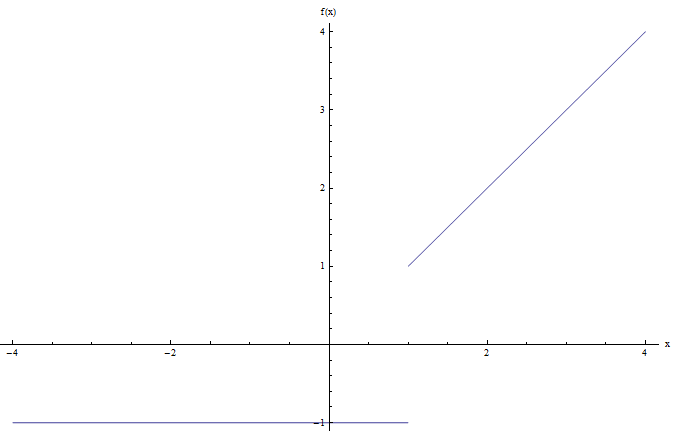
Notice that there is a jump at the point \(x = 1\), so I would say that the graph above has a jump, and hence, this function is discontinuous.
More About Graphs
Using graphs to make a representation of a function can play a crucial role for understanding the behavior of a function, in which using a graph calculator can help a lot.
There are enough analytical (Calculus) tools to understand the behavior of a function \(f(x)\), without needing to plot it. But, it is very practical to see a graph because it is a really quick way to get an idea of what the function is doing.
Observe that not all graphs must come from functions. For example, graphs can also come from relations. See the graph below and tell me if you can discover what relation is associated to it.
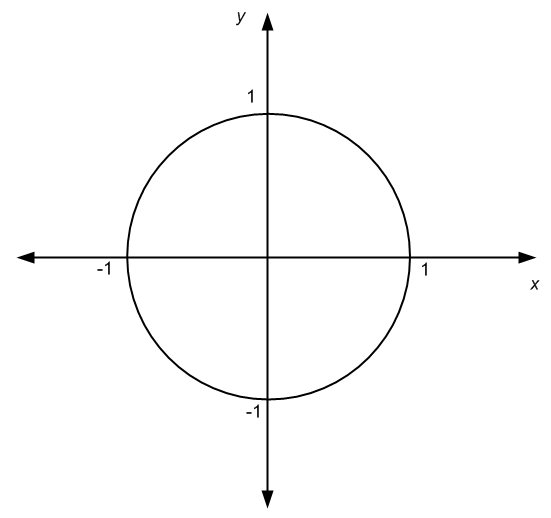
You got it right, that graph above is the representation of the equation of a unit circle, \(x^2 + y^2 = 1\), which as we know already, it determines a relation, and not a function.
If you need to construct a graph, try out function grapher to get a good depiction of how the function behaves. Having a properly constructed graph of a function can give you a wealth of information of relevant points of the function (like intercepts, asymptotes, extrema, etc).