Linear Graph
Instructions: Use this calculator to find the graph of a linear function, based on information you provide, with all the steps shown. For that purpose, you need to give some information about the linear function you want to calculate.
There are different options you can use to specify your linear function. You can provide:
(1) both the slope and the y-intercept,
(2) you can type in any linear equation (ex: \(x + 3y = 2 + \frac{4}{3}x\)),
(3) you can indicate the slope and a point that the line passes through, or
(4) you can indicate two points where the line passes through.
Linear Graphs
p>This linear graph calculator will allow you generate the graph of a linear function by providing sufficient information to determine the function.The options for defining the linear function are: (1) provide a linear equation in x and y that you can solve for y; (2) provide directly a slope m and a y-intercept n; (3) you can provide the slope of the line and a point where it passes through, or (4) you can provide two points where you know the line passes through.
Once one of the options for defining the line is successfully provided, you can click on the "Graph it" button, and you will be provided with all the steps for the creation of the graph.
The procedure of graphing a function is very simple once you know the slope and the y-intercept, so usually the hardest part is to get those when they are not directly provided. With the slope and y-intercept you can get the simplest of forms of the line, which is the slope-intercept form .
How to get a linear graph?
As we mentioned in the previous in the previous paragraph, graphing a linear function is trivial once you have the linear function in the form
\[f(x) = a + bx \]What are the steps getting a linear graph?
- Step 1: Identify the information provided, and follow the steps provided here
- Step 2: Regardless of how you define the linear function initially, you want to arrive to its slope-intercept form f(x) = a + b x
- Step 3: Once you know the slope b, and the y-intercept a, you know that the line will cross the y-axis at (0, a), and its slope is b, which means that for an increase of 1 unit in the x-axis, the value of y increases by b units (if b is negative, y decreases)
Subtracting fractions is just derived by the sum of fractions: To subtract two fractions, you just multiply the second one by -1, and the add it to the first .
How does a linear graph maker work?
The main idea is to arrive to the slope-intercept form , regardless the type of information provided. In doing so, we can get the slope and y-intercept, to elements with a clear geometric interpretation, that allows us to uniquely identify a function.
How to do a nonlinear graph?
Nonlinear functions do not have a specific structure like linear functions do, so for non-linear function we would need to use the general process of finding the graph of a function .
Of course there are notable cases of nonlinear functions that have special structures that can be analyzed separately, such as the case of the exponential graph and the logarithmic graph .
Linear Graphs Explained
There are several different ways to determine a linear graph, but the most practical one is by giving the slope and y-intercept .
The y-intercept identifies a point where the function passes through, but that is no enough, we need to know its 'direction', which is given by the slope.
Example: Linear graph
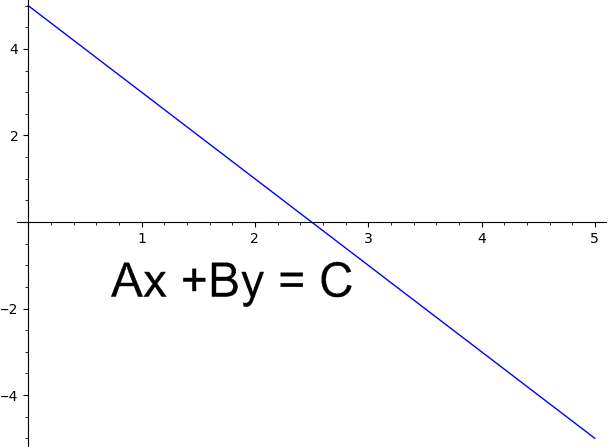
Graph the following: \(\frac{2}{3}x + \frac{5}{4}y = \frac{7}{6}\)
Solution: We have been provided with the following equation:
\[\displaystyle \frac{2}{3}x+\frac{5}{4}y=\frac{7}{6}\]which is in general form. The first thing we can do is to simplifyconstants:
\[\displaystyle \frac{2}{3}x+\frac{5}{4}y=\frac{7}{6}\]Putting \(y\) on the left hand side and \(x\) and the constant on the right hand side we get
\[\displaystyle \frac{5}{4}y = -\frac{2}{3}x +\frac{7}{6}\]Now, solving for \(y\), by dividing both sides of the equation by \(\frac{5}{4}\), the following is obtained
\[\displaystyle y=-\frac{\frac{2}{3}}{\frac{5}{4}}x+\frac{\frac{7}{6}}{\frac{5}{4}}\]and simplifying we finally get the following
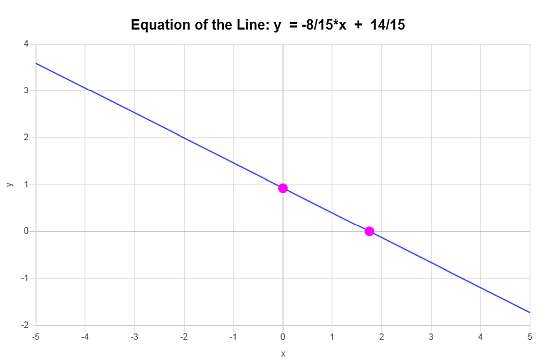
\[\displaystyle y=-\frac{8}{15}x+\frac{14}{15}\]Conclusion: Therefore, work shown above indicates that the equation is \(\displaystyle f(x)=-\frac{8}{15}x+\frac{14}{15}\), which corresponds to a line with a slope of \(\displaystyle b = -\frac{8}{15}\) and y-intercept of \(\displaystyle a = \frac{14}{15}\).
Based on this information, the graph is:
Example: More linear graphs
Interpret geometrically the graph of the linear function: \(f(x) = \frac{1}{3} + \frac{5}{4}x\)
Solution: In this case, the given function \(f(x) = \frac{1}{3} + \frac{5}{4}x\) is given in slope-intercept form, which is \(y = a + bx\).
In this context, the slope is \(b = \frac{5}{4}\), which indicates that for an increase in one unit in x, the line increases \(\frac{5}{4}\) units in y.
Also, the y-intercept is \(a = \frac{1}{3}\), which indicates that the line crosses the y-intercept at \( (0, \frac{1}{3})\).
which concludes the calculation.
Example: Another linear graph example
Is the graph of x = 4 a linear graph?
Solution: It is, in the sense that the graph is a line. But in this case, is a line with x = 4 for all values of y, so then it is a vertical line.
which concludes the calculation.
More useful linear calculators
Linear functions are SO important, that there is so much you can do with them. First, you can find perpendicular lines , and you can solve systems of equations when you have more than one linear function.
The application of linear functions and linear equations are endless in all realms of math.


