Function Graph
Instructions: Use this function graph calculator to generate the graph of a function you provide. Please type in any valid function you want to graph in the form box below.
Function Graph
This function graph calculator will allow you generate the graph of any function that you provide. You need to provide a valid function in x.
It could be function that is already simplified, such as f(x) = sin(2x), or it could be something more complex like 'f(x) = sin((1/3 x +1/4 x^2)(1/5 x +1/6))', and this calculator will do the function simplification for you.
Once you have typed a valid function in the corresponding form, you just need to click on 'Calculate' so to get the graph generated.
Working with the graph of a function can help you understand its main properties. Indeed, having the function graph can tell you ultimately all you need about the behavior of the function: is it increasing? Is it decreasing? Does it cross the x-axis? Does it have any kind of symmetry?
What is the function graph?
The function graph for a given function f(x)is the set of points (x, f(x)). This, when drawn in the x-y axes looks like a 'curve' (could be a line) that flows from from left to right.
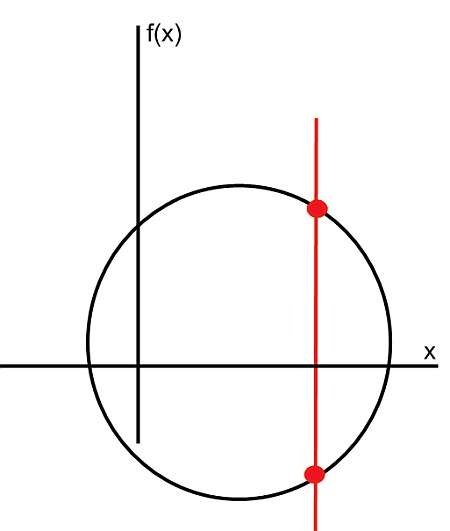
Now, this flows from left to right has one very specific property: it passes the vertical line test, which indicates that the graph of a function, when intersected with any vertical line, will have at most one point of intersection. For example, the graph below corresponds to a function graph because it passes the vertical line test.

On the other hand, the graph below does not correspond to the graph of a function, because we can see a vertical line that crosses the curve on two points.
What are the steps for finding the function graph?
- Step 1: Identify the function you want to graph. By inspection, assess whether or not the function is valid
- Step 2: If the function is a valid expression, find potential points where the function cannot be evaluated (divisions by zero or square roots of negative numbers)
- Step 3: Simplify as much as you can, so to put the function in its simplest form
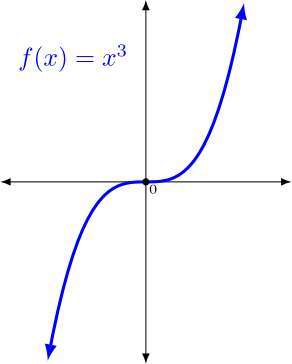
- Step 4: Try to identify known patterns. Is the function in its simplest form a polynomial? Polynomials have a specific shape. Is the function a trigonometric function? They have very well known and characteristic shape as well
- Step 5: If you don't have any simple, recognizable pattern or known function, create a table of points (x, f(x)), as many points as it is practical
- Step 6: Plot those points from your table on the XY plane. Trace a curve through those points to get a feel of how the function graph looks like
Simplifying the function to its simplest form will help you to identify in an easier way any known functions that appear and can be easily graphed.
How to graph known functions?
When simplifying a function , don't expect to directly have very simple stuff like \(f(x) = x^2\) (a simple parabola) or \(f(x) = x\) (a simple line), but you may have translations of scaled versions of those basic ones. Indeed, for example, any quadratic function can be put into vertex form , which helps you identify the curve as a simple parabola that is translated.
What are the steps for doing function graph transformations?
- Step 1: Identify the function you want to graph
- Step 2: Simplify as much as you can avoiding the trap of dividing by zero and taking square root of negative values
- Step 3: With the simplest version of the function, see if any elementary functions can be recognized
- Step 4: If not, see if any transformation of common functions (polynomials, lines, trig functions , etc) can be identified, as those are easy to graph too
- Step 5: If everything above fails, just construct a table with values (x, f(x)), and manually trace the shape of the graph
Of course you don't have to graph it manually, you can use this function graph online tool to get an accurate and neat looking graph.
Why would you like to know about function graph types?
The graph of a function can essentially tell you everything about the function. To a certain point, the graph of the function IS the function , or at least a representation of it.
There is a correspondence between function and graph, which goes to indicate that the graph essentially tells you everything you need to know about the function .
Example: Finding the function graph
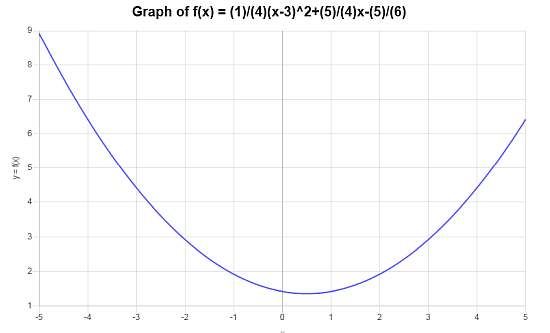
Calculate the function graph of the following: \(f(x) = \frac{1}{4}(x-3)^2 + \frac{5}{4} x - \frac{5}{6}\)
Solution: The following function has been provided \(\displaystyle f(x) = \frac{1}{4}\left(x-3\right)^2+\frac{5}{4}x-\frac{5}{6}\) for which we need to construct its graph.
Step 0: In this case, we first need to simplify the given function \(\displaystyle f(x) = \frac{1}{4}\left(x-3\right)^2+\frac{5}{4}x-\frac{5}{6} \), and in order to do so, we conduct the following simplification steps:
The following plot is obtained for the simplified function \(\displaystyle f(x)=\frac{1}{4}x^2-\frac{1}{4}x+\frac{17}{12}\) on the interval \([-5, 5]\):
Example: Function graph rules
Calculate the graph for the function \(f(x) = \frac{1}{3}(x-4)^2 - \frac{5}{6}\). Is this function a function graph transformation of a basic, well known function?
Solution: Expanding and simplifying the function:
The following plot is obtained for \(\displaystyle f(x)=\frac{1}{3}x^2-\frac{8}{3}x+\frac{9}{2}\) on the interval \([-10, 10]\):
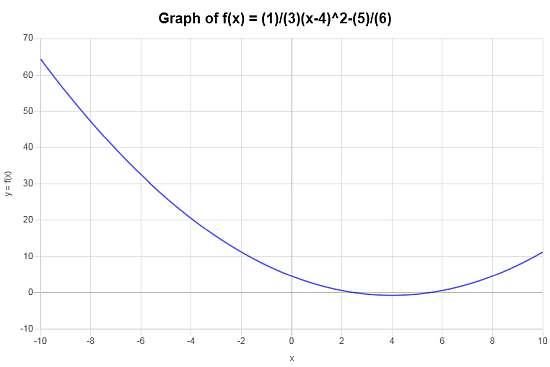
In this case the graph is \(f(x) = \frac{1}{3}(x-4)^2 - \frac{5}{6}\) indeed the transformation of the simple \(g(x) = x^2\), that has been shifted left by 4 units, shifted down by \(\frac{5}{6}\) and re-scaled.
Example: Another function graph example
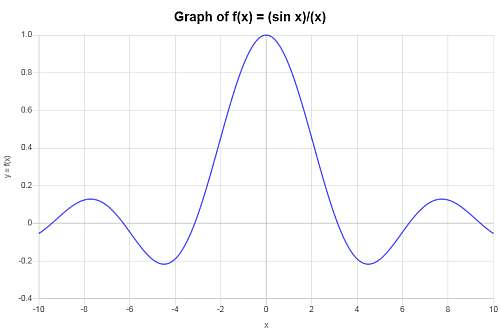
Calculate the graph of \( f(x) = \displaystyle \frac{\sin(x)}{x}\).
Solution: The following function has been provided: \(\displaystyle f(x) = \frac{\sin\left(x\right)}{x}\), so then the following plot is obtained, interval \([-10, 10]\):
Other function calculators
One advantage of using a good graph calculator is that you will consider a window that will show the most relevant information of the function. This means to choose a range of values of x to graph, and then choose an appropriate range of y values to include in that window.
Given a function you will want to be able to simplify the function , to put it in its simplest form. We already saw that is beneficial to identify in an easier way the potential function graph transformation from basic functions that can be there.


