Graph Calculator
Instructions: Use this graph calculator to plot the graph of any function you provide. Please type in a valid function you want to plot in the form box below.
More on this graph calculator
Use this graph calculator to plot a graph of a function you provide. You can plot a simple function like f(x) = x^2, or you could also provide something more complex like f(x) = tan(x)/x. This calculator will attempt to simplify the expression before graphing it.
Once a valid function is provided, all you need to do is to click the "Graph" button, and you will be provided with the graph online, plus any relevant simplifications, if any.
Notice that a valid function is needed, so that the system knows without ambiguity what is the function you intend to graph. For example, something like (sin(x))/x is valid, but something like sin x / x is ambiguous, and the system will try parse it in a way that perhaps you did not intend.
How to go about graphing functions?
Graphing can be super simple when the functions are simple. The idea is just to identify the pairs (x, y) = (x, f(x)) and find the appropriate window frame for displaying them.
This graphing calculator online will make it easier for you by deciding the relevant points to graph and choosing the correct window to display.
Steps for graphing a function
- Step 1: Identify clearly the function you want to plot, and carry out any obvious simplification. For example, if the function somewhere contains \(\sin^2(x) + \cos^2(x)\), you have to observe that \(\sin^2(x) + \cos^2(x) = 1\) and then simplify that in your expression.
- Step 2: Once all the obvious simplifications are done, you need to decide on a range for the x values. There is no fixed rules for this, but usually you need to take into account any relevant points, like discontinuities, vertical asymptotes, etc.
- Step 3: Once the range of x value is decided, you need to get an idea of the range of y-values, so that no points of the graph will be out of frame.
So then, the idea of graphing is simple, but you still need to decide on a few things if you were to do things manually. Using a graphing tool will definitely remove any guesswork.
Why do I need to graph function
The graph provided by this graphing calculator online will make sure you get a real good depiction of the behavior of the function. Does it cross the x or y axis, does it have local maximum or minimum points? You can get a lot of relevant information about the function with just looking at the graph.
You won't necessarily know the exact intercepts or extrema by just looking at the graph, but you will have a pretty good idea about where to find them, if they exist even.

Benefits of using a graphing tool
Like we said, it is not that it is too difficult to make a graph, but there are details that need to be arranged, especially those deciding the window frame that will be displayed.
This means that you can have a "correct" graph for a function but that is displaying a portion of the graph that is not the most relevant, and you may be missing most of the important parts of the function, that would be good to display. A good graph maker will take car of that for you.
Example: Calculating the graph of a function
Find the graph of the function: \(f(x) = \displaystyle \frac{\sin x}{x}\)
Solution: The following function has been provided: \(\displaystyle f(x)=\frac{\sin\left(x\right)}{x}\), for which we need to construct its graph.
Notice that the function is not defined at \(x = 0\), though it has a repairable discontinuity, since
\[\lim_{x\to 0} \frac{\sin x}{x} = 1\]The following plot is obtained for the given function on the interval \([-5, 5]\):
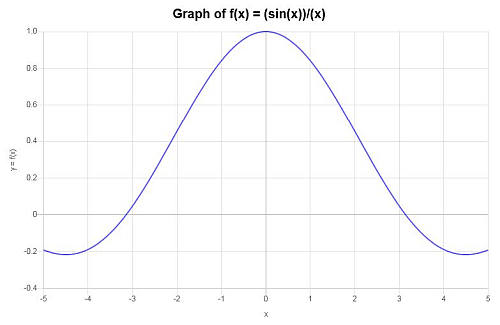
which concludes the calculation.
More graphing calculators online
Although this graph maker is generic in the sense that it can plot any type of function, you can also use some specialized type of graph for specific functions, which can give you more information based on the structure of the function .
For example you can use line graph calculator that is especially designed for graphing lines. Or, if you are dealing with trig function, you can use this trig calculator which will also try to find specific parameters of trig functions, including amplitude, period, frequency, etc.
Or you can use this polynomial graph when dealing with, you bet, polynomials.
Also, you can use this exponential function calculator , to find the parameters of an exponential function given two points where the curve passes through.


