Inequality Grapher
Instructions: You can use this calculator to graph any inequality you provide, showing all the steps of the solution. Please type in the inequality you want to graph and solve in the box below.
About this inequality grapher
This calculator will help you find the solution and graph for any general inequality, showing all the steps. You need to provide a valid inequality of one variable (x), by typing it in the box provided.
For example, you can provide a simple linear inequality like '3x - 1 < 1/3', or something like '2x-x^2 <= 3/4', which corresponds to a quadratic inequality.
Once you have provided the inequality you want to graph, go ahead and click on the "Solve" button, so to be presented with the solutions, with all the steps, in case that it was possible to find solutions.
Solving general equations and general inequalities is in general a difficult task, except for a specific set of structures that are amenable to a systematic treatment.
Some of the few types that allow exact solution are linear inequalities and polynomial inequalities .
An important type of inequality you will like to solve is the case of rational inequalities, in which you can identify a quotient of polynomials. Those inequalities are interesting since they have potential divisions by zero that need to be addressed. The idea of a rational inequality can easily be extended to the quotient of functions in general, not necessarily polynomials

How Graph an Inequality
The simplest answer to it is: in order to graph an inequality, you need to know how to solve it. The graphical solution to an inequality is usually represented as an interval or several joined intervals on the x axis.
So, with that being said, graphing an inequality will start with solving it first, which involves finding a set of values in the real line that satisfy the provided inequality.
You can potentially present the graph as a standalone interval, or you can plot the inequality solutions along with the graph of the expression that is underlying the inequality: let us recall that in order to solve inequalities , you pass all the terms to one side (which gives you the underlying expression) and solve an auxiliary equation
Steps for Solving and Graphing Inequalities
- Step 1: Pass all the terms to one side, so you have one expression on one side, and you have zero on the other side
- Step 2: From the inequality (once everything is on one side and zero on the other), construct an auxiliary equation
- Step 3: Solve this equation, with a method that is suitable for its structure (different types of equations will require specific techniques and approaches)
- Step 4: Based on the REAL solutions of the auxiliary equations (real as opposed to complex solutions), you construct your critical points, and sort them in ascending order
- Step 5: You also need to look for points where the expression is undefined. One notable case of this occurs with rational inequalities, in which you have a denominator that is a polynomial, so then the expression will be undefined on the zeroes of the denominator. So you add zeroes of the denominator to the list of critical points
- Step 6: With your critical points, you construct intervals using consecutive critical points (using -∞ and ∞ as the starting and ending critical points)
- Step 7: For each interval, analyze the sign of the expression and see if it is compatible with the sign of the inequality. If it is, then the interval will be a part of the overall solution to the inequality
Using critical points for the analysis is of utmost importance, because that way you are sure that the expression does not change signs within each interval, so that the problem gets reduced to assessing whether the inequality is solved for each of those critical intervals.
To make it a bit more tangible, you have some inequality given, and then you passed everything to one side, so you have something of the form \(f(x) \le 0\). For example, this could be something like \(x^2 - x + 1 \le 0\).
So then you take \(f(x) \le 0\) and you find the auxiliary equation \(f(x) = 0\). You take the expression \(f(x)\) and find its zeros to be the critical points. But not only do you do that, but also see if \(f(x)\) is undefined anywhere (divisions by zero, etc.). It maybe defined everywhere, like in the case \(x^2 - x + 1\), but if you find points where the expression is undefined, you add it to the list of critical points.
Then you construct intervals based on consecutive critical points. For the \(f(x) \le 0\), you will take as a part of the solutions those intervals where the value of the expression is negative. If the original inequality would have been \(f(x) \ge 0\) you will take as a part of the solutions those intervals where the value of the expression is positive
How this Inequality Grapher Works
Our inequality grapher online will take care of one of the most cumbersome processes in basic Algebra, which is dealing with finding the solutions of an inequality and graphing them. One big advantage of our calculator is that it will show all the steps, when possible.
First, the grapher will solve the inequality by first solving a suitable auxiliary equation. This process requires detecting specific known structures, as all structures likely require different approaches. For example, to solve a rational inequality (which involves the quotient of two polynomials) such as for example
\[\displaystyle \frac{x^2-2x}{x-1} \ge 4 \]you will require a different approach than the one used to solve a quadratic inequality like \(x^2 + 3x < 1\), for example, and this calculator will take of all of those detail.s

If no traditional or commonly known structure is detected, different commonly used substitutions will be used, such as for example \(u = \sqrt x\) or \(u = \sin x\). If nothing works, the calculator will attempt to find solutions by inspection and numerically, so that to get at least an idea of the solutions..
How do you present an inequality graph?
As we mentioned above, it is not really written on stone, but the most common way is to graph the underlying expression of the inequality, and highlight the x values that satisfy the inequality. This is the possibly the best graphing format for this, and it is what is used by this grapher.
You can also draw an standalone interval object, but that is possibly less telling, as it loses perspective of what is actually happening with the inequality itself.

Example: Graphing inequalities
Graph the following inequality: \(\frac{1}{x}+x > 1\)
Solution: We are given the following inequality that needs to be solved:
\[\frac{1}{x}+x > 1\]We need to put all terms of the inequality on one side:
\[x+\frac{1}{x}-1>0\]Solving Auxiliary Equation
From the above inequality, we obtain the associated equation that needs to be solved first:
\[x+\frac{1}{x}-1=0\]Critical Points Analysis
We need to organize the critical points found (from the real roots of the numerator and denominator) in ascending order, define intervals with all the consecutive critical points, and assess the sign of the left-hand size of the inequality on each of those intervals.
The only critical point that was found is \(0\).
Based on this, we need to analyze the following intervals:
• For the interval \(\left(-\infty, 0\right)\): The numerator is positive and the denominator is negative, so then the left-hand side is negative, which implies that \(\left(-\infty, 0\right)\) is not part of the solution.
• For the interval \(\left(0, \infty\right)\): The numerator is positive and the denominator is positive, so then the left-hand side is positive, so then \(\left(0, \infty\right)\) is part of the solution.
Solution to the Inequality
Based on the inequality provided, and analyzing the critical points, we find that the solution to the inequality is: \(x > 0\).
Using interval notation, the solution is written as:
\[\left(0,\infty\right)\]The following is obtained with the inequality grapher:
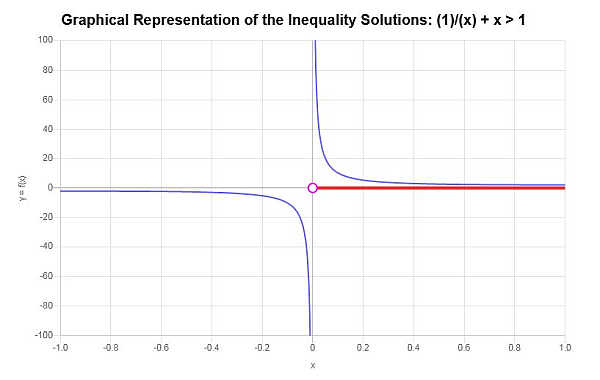
which concludes the calculation.
Example: Graphing polynomial inequalities
Find the graph the inequality: \(x^2 - 2x \ge 4\)
Solution:
We need to put all terms of the inequality on one side:
\[x^2-2x-4\ge0\]Solving Auxiliary Equation
From the above inequality, we obtain the associated equation that needs to be solved first:
\[x^2-2x-4=0\]Using the Quadratic Formula
For a quadratic equation of the form \(a x^2 + bx + c = 0\), the roots are computed using the following formula:
\[x = \displaystyle \frac{-b \pm \sqrt{b^2-4ac}}{2a}\]In this case, we have that the equation we need to solve is \(\displaystyle x^2-2x-4 = 0\), which implies that corresponding coefficients are:
\[a = 1\] \[b = -2\] \[c = -4\]First, we will compute the discriminant to assess the nature of the roots. The discriminating is computed as:
\[\Delta = b^2 - 4ac = \displaystyle \left( -2\right)^2 - 4 \cdot \left(1\right)\cdot \left(-4\right) = 20\]Since in this case we get the discriminant is \(\Delta = \displaystyle 20 > 0\), which is positive, we know that the equation has two different real roots.
Now, plugging these values into the formula for the roots we get:
\[x = \displaystyle \frac{-b \pm \sqrt{b^2-4ac}}{2a} = \displaystyle \frac{2 \pm \sqrt{\left(-2\right)^2-4\left(1\right)\left(-4\right)}}{2\cdot 1} = \displaystyle \frac{2 \pm \sqrt{20}}{2}\]so then, we find that:
\[ {x}_1 = \frac{2}{2}-\frac{1}{2}\sqrt{20}=\frac{2}{2}-\sqrt{5}=1-\sqrt{5}=-\sqrt{5}+1 \] \[{x}_2 = \frac{2}{2}+\frac{1}{2}\sqrt{20}=\frac{2}{2}+\sqrt{5}=1+\sqrt{5}=\sqrt{5}+1\]In this case, the quadratic equation \( \displaystyle x^2-2x-4 = 0 \), has two real roots, so then:
\[\displaystyle x^2-2x-4 = \left(x+\sqrt{5}-1\right)\left(x-\sqrt{5}-1\right)\]so then the original polynomial is factored as \(\displaystyle p(x) = x^2-2x-4 = \left(x+\sqrt{5}-1\right)\left(x-\sqrt{5}-1\right) \), which completes the factorization.
Critical Points Analysis
The list of critical points found organized in ascending order is: \(-\sqrt{5}+1\), \(\sqrt{5}+1\).
Based on this, we need to analyze the following intervals:
• For the interval \(\left(-\infty, -\sqrt{5}+1\right)\): The left-hand side is positive, so then \(\left(-\infty, -\sqrt{5}+1\right)\) is part of the solution.
• For the interval \(\left(-\sqrt{5}+1, \sqrt{5}+1\right)\): The left-hand side is negative, so then \(\left(-\sqrt{5}+1, \sqrt{5}+1\right)\) is not part of the solution.
• For the interval \(\left(\sqrt{5}+1, \infty\right)\): The left-hand side is positive, which implies that \(\left(\sqrt{5}+1, \infty\right)\) is part of the solution.
Solution to the Inequality
Based on the inequality provided, and analyzing the critical points, we find that the solution to the inequality is: \(x \le -\sqrt{5}+1\) or \(x \ge \sqrt{5}+1\).
Using interval notation, the solution is written as:
\[\left(-\infty,-\sqrt{5}+1\right] \cup \left[\sqrt{5}+1,\infty\right)\]Graphically:
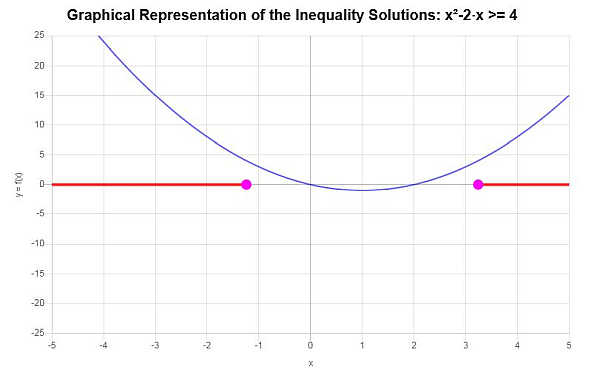
which concludes the calculation.
More Algebra calculators
As you advance in your learning of Algebra and Calculus, you have probably realized slowly that solving equations play a crucial role. And as you learn more, you realize that sometimes we have less information and we end up facing with the problem of solving inequalities .
In essence, solving inequalities is not harder than solving equations, it just takes a few more organized steps. The main problem is that we cannot really solve most equations, at least exactly.
And even if solving equations numerically, we don't have good ways yet to ensure we have found ALL the solutions to ALL possible equations. Some remarkable equations that can be solved and appear in applications all the time are the polynomial equations , which you can solve using mostly standard methods ( but only for polynomials of lower degree)
One of the most commonly asked type of inequalities that you need to solve in your math tests is the rational inequalities, because they are the hardest simple inequality that you can sort of guarantee finding a solution (provided that the degrees involved are low enough, or the polynomials are simple enough).


