Two Sample z-test calculator
Instructions: Use this two-sample z-test calculator to get the results of a t-test when two samples are provided, along with the corresponding population standard deviations. Please provide the required information below
Two Means Z-test Calculator
This calculator allows to run a z-test for two means, showing all the steps. The z-test is very similar to a t-test , but with a clear difference that for the case of a z-test we need to know the corresponding population standard deviation.
For this test you need to provide two samples, plus the corresponding population standard deviation for each group. You may be wondering, what happens if I don't have those population standard deviations: the answer is simple: then you CANNOT run the z-test for two means.
Once you have provided all the required data, all you have to do is to click on "Calculate", and all the steps of the process will be shown to you.
What is a two-sample z-test?
A two-sample z-test is a type of z-test which compares the means of two groups. You can provide either the sample data (along with the population standard deviations), or you can run a z-test for two mean with summarized data , for which you need to provide the sample means in lieu of sample data.
Which of the two processes you will run, the z-test for sample data or for summarized data will largely depend on what information you have available.
Z-test for two means formula
There is a simple expression for the formula used in this test. The z-test formula is
\[z = \displaystyle{\frac{\bar X_1 - \bar X_2}{\sqrt{\displaystyle{\frac{\sigma_1^2}{n_1}} + \displaystyle{\frac{\sigma_2^2}{n_2}} }}} \]The advantage in this case is that we don't need to deal with degrees of freedom, like in the case of the t-test for two means , and with t-tests in general.
How to do a 2 sample z-test on this calculator?
- Step 1: Identify the samples you want to compare. Usually, you will like to conduct some descriptive statistics analysis to ensure that the samples are reasonably bell-shaped
- Step 2: You also need to identify the population standard deviations \(\sigma_1\) and \(\sigma_2\). If you don't have them, you cannot run a z-test
- Step 3: From the samples, you need to find the sample means \(\bar X_1\) and \(\bar X_2\)
- Step 4: Now, you just plug your information into the formula \(z = \displaystyle{\frac{\bar X_1 - \bar X_2}{\sqrt{\displaystyle{\frac{\sigma_1^2}{n_1}} + \displaystyle{\frac{\sigma_2^2}{n_2}} }}}\)
- Step 5: Once you have the z-statistic, which you call, \(z_{obs}\) you need to compute the p-value
- Step 6: For left-tailed tests you compute \(p = \Pr(Z < z_{obs})\). For right-tailed tests you compute \(p = \Pr(Z > z_{obs})\) and for two-tailed tests you compute \(p = \Pr(|Z| > z_{obs})\)
- Step 7: Once you have the p-value, you make a conclusion based on the chosen value of the significance level \(\alpha\): if \(p < \alpha\), you reject the null hypothesis, and otherwise, you don't have enough evidence to reject the null hypothesis
One important point: if you don't reject the null hypothesis Ho, that does not mean that you accept the null hypothesis, it just means you could not find enough evidence to reject it.
How is this different to the z-test for two proportions?
The are similar in the sense that they are both z-tests, which use the normal distribution to determine all the associated probabilities.
The difference is that they are measuring different things: The z-test for two means compare the means of two groups, where these variables are measured at the interval or ratio level, whereas the z-test for two proportions will compare the proportion of a certain characteristic associated with the data.
How to do a two sample z-test in Excel?
Excel has internal functions that allow you to run a z-test and many other procedures, but it does not show you all the steps of the process like this calculator does.
In the end, you may be able to get a numerical answer from Excel or another calculator, but you won't have the steps on how do you actually find the z-test on a regular calculator.

An example of a two means z-test
An instructor is testing a method of teaching, and she gets a sample of 10 students undergo one method, and another sample of 11 students undergo the other method. The grades obtained after teaching using those methods are:
Group 1: 89, 78, 90, 100, 90, 92, 90, 80, 89, 93
Group 2: 91, 89, 91, 95, 92, 93, 91, 87, 90, 94, 90
Also, she knows that the population standard deviation of scores for the first method is 3.4, whereas for the second is 4.1. Can the instructor conclude that there is a significant difference between the methods? Use a significance level of .05
Solution:
The following information sample information has been provided:
| Sample 1 | Sample 2 |
| 89 | 91 |
| 78 | 89 |
| 90 | 91 |
| 100 | 95 |
| 90 | 92 |
| 92 | 93 |
| 90 | 91 |
| 80 | 87 |
| 89 | 90 |
| 93 | 94 |
| 90 |
In order to conduct a two-independent sample z-test, we need to compute descriptive statistics of the samples:
| Sample 1 | Sample 2 | |
| 89 | 91 | |
| 78 | 89 | |
| 90 | 91 | |
| 100 | 95 | |
| 90 | 92 | |
| 92 | 93 | |
| 90 | 91 | |
| 80 | 87 | |
| 89 | 90 | |
| 93 | 94 | |
| 90 | ||
| Average | 89.1 | 91.1818 |
| n | 10 | 11 |
Summarizing, the following descriptive statistics will be used in the calculation of the z-statistic:
The following information has been provided:
| Sample Mean 1 \((\bar X_1)\) = | \(89.1\) |
| Population Standard Deviation 1\((\sigma_1)\) = | \(3.4\) |
| Sample Size 1\((n_1)\) = | \(10\) |
| Sample Mean 2 \((\bar X_2)\) = | \(91.1818\) |
| Population Standard Deviation 2 \((\sigma_2)\) = | \(4.1\) |
| Sample Size 2\((n_2)\) = | \(11\) |
| Significance Level \((\alpha)\) | \(0.05\) |
(1) Null and Alternative Hypotheses
The following null and alternative hypotheses need to be tested:
\[ \begin{array}{ccl} H_0: \mu_1 & = & \mu_2 \\\\ \\\\ H_a: \mu_1 & \ne & \mu_2 \end{array}\]This corresponds to a two-tailed test, and a z-test for two means, with known population standard deviations will be used.
(2) Rejection Region
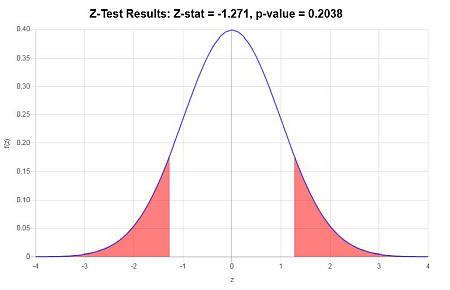
Based on the information provided, the significance level is \(\alpha = 0.05\), and the critical value for a two-tailed test is \(z_c = 1.96\).
The rejection region for this two-tailed test is \(R = \{z: |z| > 1.96\}\)
(3) Test Statistics
The z-statistic is computed as follows:
\[ \begin{array}{ccl} z & = & \displaystyle \frac{\bar X_1 - \bar X_2}{\sqrt{ {\sigma_1^2/n_1} + {\sigma_2^2/n_2} }} \\\\ \\\\ & = & \displaystyle \frac{ 89.1 - 91.1818}{\sqrt{ {3.4^2/10} + {4.1^2/11} }} \\\\ \\\\ & = & -1.271 \end{array}\](4) Decision about the null hypothesis
Since it is observed that \(|z| = 1.271 \le z_c = 1.96\), it is then concluded that the null hypothesis is not rejected.
Using the P-value approach: The p-value is \(p = 0.2038\), and since \(p = 0.2038 \ge 0.05\), it is concluded that the null hypothesis is not rejected.
(5) Conclusion
It is concluded that the null hypothesis Ho is not rejected. Therefore, there is not enough evidence to claim that the population mean \(\mu_1\) is different than \(\mu_2\), at the \(\alpha = 0.05\) significance level.
Confidence Interval
The 95% confidence interval for \(\mu_1-\mu_2\) is \(-5.293 < \mu_1 - \mu_2 < 1.129\).
Graphically
More statistical test calculators
Closely related to this calculator, you have the calculator for a z-test for two samples with summarized data , which basically conducts the same procedure, but it receives the summary of descriptive statistics already known.
Within the family of z-tests , we have the z-test for one mean, and the z-test for two proportions .
Also, you may be interested in a mixed fraction calculator , depending on your learning setting. In more elementary settings, mixed numbers are treated as important entities, whereas in more advanced settings, mixed numbers are just presented in their fraction notation.


