Two Sample t test calculator
Instructions: Use this calculator to work on a two-samples t-test, showing all the steps. In order to run the test, you need two provide two independent samples in the spreadsheet below. You can either type the data or simply paste them from Excel.
Two-sample t-test calculator
This calculator will allow you to get all the details and steps related to the calculation of a two-sample t-test. The process for conducting a t-test is relatively simple, but it requires lots of calculations often times, which will be shown to you in detail by this calculator.
The first step in using this calculator is to use the spreadsheet in which you need to either type or paste the data. You can have your data originally in Excel and then paste it in, no problem. After you type or paste the data, all you need to do is to click on "Calculate" to get all the steps shown.
There are lots of subtleties involved in the process of conducting a t-test. There are certain distribution assumptions that need to be met, it needs to be assessed whether or not the population standard deviation can be assumed to be equal . Once the assumption requirements are cleared, we can proceed with the test statistic calculation.
Independent t-test Calculator with Samples
Usually there are two different forms that can lead to calculating an independent t-test. You can either have two samples, or you can have the data already summarized. For the latter, use this independent t-test calculator with summarized data .
For the case of two samples, you will first need to conduct descriptive statistics calculations in order to get a summary of the provided independent samples.
Steps for running a independent t-test
- Step 1: Identify the samples provided. Those samples need to be at least approximately normal
- Step 2: Usually it is out of the scope of what is required to conduct formal statistical tests, in which case you would like to create a histogram of the samples, to see if they look at least approximately bell-shaped
- Step 3: If you do need to formally test for the normality of the samples, you can use this normality test calculator
- Step 4: Once you have cleared the assumptions (if needed), you can proceed with running the actual t-test
- Step 5: One previous step that is needed too is that about assessing whether the population standard deviations can be assumed to be equal or not
Why do we need to test for the equality of population variances? This is because there is the need to find the standard error for the test, and it turns out that the optimal choice for the standard error depends on whether the population standard deviations are equal or not.
That is a rather technical topic, but in layman terms, if the population variances are equal, then the best choice is to basically pool the available sample variances to get a good standard error estimate.
But if they are not equal, things get a bit more complicated, and some technical corrections are needed, which is what you see reflected in the fact that the formula used is different, and the degrees of freedom are different too.
What is the t-value in a 2 sample test?
The formula used for the independent samples t-test will depend upon whether or not the population variances are assumed to be equal. If they are assumed to be unequal, the formula used is
\[t = \frac{\bar X_1 - \bar X_2}{\sqrt{ \frac{s_1^2}{n_1} + \frac{s_2^2}{n_2} }}\]But, if the population variances are assumed to be equal, you then need to use the following formula:
\[t = \frac{\bar X_1 - \bar X_2}{\sqrt{ \frac{(n_1-1)s_1^2 + (n_2-1)s_2^2}{n_1+n_2-2}(\frac{1}{n_1}+\frac{1}{n_2}) } }\]
Equality of Population Variances
When to assume equality of population variances? There is a formal test, which is the F-test for equality of variances, which is conducted by this calculator if you select the option.
Sometimes, different rules of thumb are used, like taking the highest of sample variance, divide by the lowest sample variance and assume that the population variances are equal if this ratio is less than 3, or another rule like that. That is not a completely bad idea, but if you really need to know, it is best to run a formal test.
What are the steps for computing the t-test formula
- Step 1: Assess whether or not the population variances are equal. Run a F-test for equality of variances if needed
- Step 2: Depending on whether equality of population variances is assumed or not, you will choose the right formula for the t-test
- Step 3: For unequal population variances, you use \(t = \frac{\bar X_1 - \bar X_2}{\sqrt{ \frac{s_1^2}{n_1} + \frac{s_2^2}{n_2} }}\)
- Step 4: For equal population variances, you use \(t = \frac{\bar X_1 - \bar X_2}{\sqrt{ \frac{(n_1-1)s_1^2 + (n_2-1)s_2^2}{n_1+n_2-2}(\frac{1}{n_1}+\frac{1}{n_2}) } }\)
- Step 5: Based on the number of degrees of freedom and type of tail, you compute the corresponding p-value, and if the p-value is less than the significance level, the null hypothesis is rejected
The number of degrees of freedom when equal population variances are assumed is \(df = n_1 + n_2\), where \(n_1\) and \(n_2\) are the corresponding sample sizes . Now for unequal variances, the calculation of degrees of freedoms is a lot more complicated.
Is this a t-test calculator with steps?
Yes! This calculator will show you all the steps of the way, from the calculation of descriptive statistics, to the testing for equality of variances (if required) to the use of the proper t-test formula to the discussion and conclusions.
Why is this test statistic calculator useful? Time! You will save lots of time because an independent samples t-test requires a whole lot of calculations.
What is an example of a 2 sample t-test?
Suppose that a teacher believes that the average height of eighth graders for two different schools. There is a sample of n = 10 kids for each school, for which their sample heights (in inches) are available:
School 1: 60, 62, 59, 63, 65, 64, 68, 67, 61, 60
School 1: 60, 61, 61, 61, 60, 59, 59, 60, 60, 59
Is there enough evidence to claim that the population mean heights for two schools are different, at the 0.05 significance level?
Solution: The following information sample information has been provided:
| Sample 1 | Sample 2 |
| 60 | 60 |
| 62 | 61 |
| 59 | 61 |
| 63 | 61 |
| 65 | 60 |
| 64 | 59 |
| 68 | 59 |
| 67 | 60 |
| 61 | 60 |
| 60 | 59 |
In order to conduct a two-independent samples t-test, we need to compute descriptive statistics of the samples:
| Sample 1 | Sample 2 | |
| 60 | 60 | |
| 62 | 61 | |
| 59 | 61 | |
| 63 | 61 | |
| 65 | 60 | |
| 64 | 59 | |
| 68 | 59 | |
| 67 | 60 | |
| 61 | 60 | |
| 60 | 59 | |
| Average | 62.9 | 60 |
| St. Dev. | 3.0714 | 0.8165 |
| n | 10 | 10 |
Summarizing, the following descriptive statistics will be used in the calculation of the t-statistic:
The following information has been provided:
| Sample Mean 1 \((\bar X_1)\) = | \(62.9\) |
| Sample Standard Deviation 1 \((s_1)\) = | \(3.0714\) |
| Sample Size \((n_1)\) = | \(10\) |
| Sample Mean 2 \((\bar X_2)\) = | \(60\) |
| Sample Standard Deviation 1 \((s_2)\) = | \(0.8165\) |
| Sample Size \((n_2)\) = | \(10\) |
| Significance Level \((\alpha)\) = | \(0.05\) |
(1) Null and Alternative Hypotheses
The following null and alternative hypotheses need to be tested:
\[ \begin{array}{ccl} H_0: \mu_1 & = & \mu_2 \\\\ \\\\ H_a: \mu_1 & \ne & \mu_2 \end{array}\]This corresponds to a two-tailed test, for which a t-test for two population means, with two independent samples, with unknown population standard deviations will be used.
Testing for Equality of Variances
A F-test is used to test for the equality of variances. The following F-ratio is obtained:
\[F = \frac{s_1^2}{s_2^2} = \frac{ 3.0714^2}{ 0.8165^2} = 14.15\]The critical values are \(F_L = 0.248\) and \(F_U = 4.026\), and since \(F = 14.15\), then the null hypothesis of equal variances is rejected.
(2) Rejection Region
Based on the information provided, the significance level is \(\alpha = 0.05\), and the degrees of freedom are \(df = 10.266\). In fact, the degrees of freedom are computed as follows, assuming that the population variances are unequal:
\[df_{Total} = \displaystyle \frac{\left( \frac{s_1^2}{n_1}+\frac{s_2^2}{n_2} \right)^2 }{\frac{(s_1^2/n_1)^2}{n_1-1} + \frac{(s_2^2/n_2)^2}{n_2-1} } = 10.265751649094\]Hence, it is found that the critical value for this two-tailed test is \(t_c = 2.22\), for \(\alpha = 0.05\) and \(df = 10.266\).
The rejection region for this two-tailed test is \(R = \{t: |t| > 2.22\}\).
(3) Test Statistics
Since it is assumed that the population variances are unequal, the t-statistic is computed as follows:
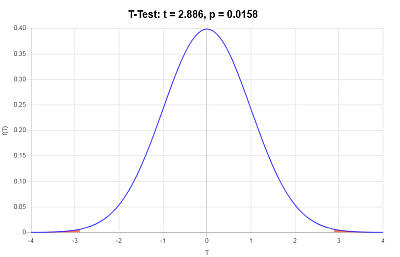
\[t = \displaystyle\frac{\bar X_1 - \bar X_2}{\sqrt{ \frac{s_1^2}{n_1} + \frac{s_2^2}{n_2} }}\] \[ = \displaystyle\frac{ 62.9 - 60}{\sqrt{ \frac{ 3.0714^2}{ 10} + \frac{ 0.8165^2}{ 10} }} = 2.886\](4) Decision about the null hypothesis
Since it is observed that \(|t| = 2.886 > t_c = 2.22\), it is then concluded that the null hypothesis is rejected.
Using the P-value approach: The p-value is \(p = 0.0158\), and since \(p = 0.0158 < 0.05\), it is concluded that the null hypothesis is rejected.
(5) Conclusion
It is concluded that the null hypothesis Ho is rejected. Therefore, there is enough evidence to claim that the population mean \(\mu_1\) is different than \(\mu_2\), at the \(\alpha = 0.05\) significance level.
Confidence Interval
The 95% confidence interval is \(0.669 < \mu < 5.131\).
Graphically
Other statistical tests of interest
There is an abundance of related statistical tests that you can use. You can try for example this paired t-test calculator . Also you can you this t-test for two samples when you have summarized sample data instead. In that case, the sample data provided is usually the sample means , sample standard deviations and sample sizes.
Other type of t-test calculators include the t-test for one sample . For different types of statistics, you can try this ANOVA calculator , which is similar to the t-test only that with ANOVA you can compare more than 2 groups.

