Linear Regression Calculator
Instructions: Perform a regression analysis by using the Linear Regression Calculator , where the regression equation will be found and a detailed report of the calculations will be provided, along with a scatter plot. All you have to do is type your X and Y data. Optionally, you can add a title and add the name of the variables.
More about this Linear Regression Calculator
A linear regression model corresponds to a linear model that minimizes the sum of squared errors for a set of pairs \((X_i, Y_i)\).
This is, you assume the existence of a model which in its simplified form is \(Y = \alpha + \beta X\) and then you take note of the discrepancies (errors) found when using this linear model to predict the set of given data.
For each \(X_i\) in the data, you compute \(\hat Y_i = \alpha + \beta X_i\), and you compute the error by measuring \(Y_i - \hat Y_i\). More specifically, in this case you take the square of each discrepancy/error and you add up ALL these square errors.
The objective of a regression calculator is to find the best values of \(\alpha\) and \(\beta\) so that the sum of squared errors is as small as possible.
Regression Formula
The linear regression equation, also known as least squares equation has the following form: \(\hat Y = a + b X\), where the regression coefficients are the values of \(a\) and \(b\).
The question is: How to calculate the regression coefficients? The regression coefficients are computed by this regression calculator as follows:
\[b = \frac{SS_{XY}}{SS_{XX}}\] \[a = \bar Y - \bar X \cdot b \]These are the formulas you used if you were to calculate the regression equation by hand, but likely you will prefer to use a calculator (our regression calculator ) which will show you the important steps.
This linear regression formula is interpreted as follows: The coefficient \(b\) is known as the slope coefficient, and the coefficient \(a\) is known as the y-intercept.
If instead of a linear model, you would like to use a non-linear model, then you should consider instead a polynomial regression calculator , which allows you to use powers of the independent variable.
Linear regression calculator Steps
First of all, you want to assess whether or not it makes sense to run a regression analysis. So then first you should run this correlation coefficient calculator to see if there is a significant degree of linear association between the the variables.
In other words, it only makes sense to run a regression analysis the correlation coefficient is strong enough to make a case for a linear regression model. Also, you should use this scatter plot calculator to ensure that the visual pattern is indeed linear.
It is conceivable that a correlation coefficient is close to 1, but yet the pattern of association is not linear at all.
The steps to conduct a regression analysis are:
Step 1: Get the data for the dependent and independent variable in column format.
Step 2: Type in the data or you can paste it if you already have in Excel format for example.
Step 3: Press "Calculate".
This regression equation calculator with steps will provide you with all the calculations required, in an organized manner, so that you can clearly understand all the steps of the process.
Regression Residuals
How do we assess if a linear regression model is good? You may think "easy, just look at the scatterplot ". In reality, math and statistics tend to go beyond where the eye meets the graph. It is usually risky to rely solely on the scatterplot to assess the quality of the model.
In terms of goodness of fit, one way of assessing the quality of fit of a linear regression model is by computing the coefficient of determination , indicates the proportion of variation that in the dependent variable that is explained by the independent variable.
In linear regression, the fulfillment of the assumptions is crucial so that the estimates of the regression coefficient have good properties (being unbiased, minimum variance, among others).
In order to asses the linear regression assumptions, you will need to take a look at the residuals. For that purpose, you can take a look at our residual calculator .
Predictive Power of a Regression Equation
How can you tell if the regression equation found is good? Or a better question, how to know whether or not the regression equation estimated has good predictive power?
What you need to do is to compute the coefficient of determination , which tells you the amount of variation in the dependent variable that is explained by the dependent variable(s).
For a simple regression model (with one independent variable), the coefficient of determination is simply computed by squaring the correlation coefficient.
For example, if the correlation coefficient is r = 0.8, then the coefficient of determination is \(r^2 = 0.8^2 = 0.64\) and the interpretation is that 64% of the variation in the dependent variable are explained by the independent variable in this model.
Polynomial regression
As we have mentioned before, there are times where the linear regression is simply not appropriate, because there is a clear non-liner pattern governing the relationship between two variables.
Your first signal that polynomial regression should be used instead of linear regression is to see that there is a curvilinear pattern in the data presented by the scatterplot.
If that is the case, you could try this polynomial regression calculator , to estimate a non-linear model that has a better chance of having a better fit.
What is given by this online linear regression calculator?
First, you get a tabulation of the data, and you calculate the corresponding squares and cross-multiplications to get the required sum of squared values, needed to apply the regression formula.
Once that is all neatly shown in a table with all the needed columns, the regression formulas will be shown, with the correct values being plugged in and then with a conclusion about the linear regression model that was estimated from the data.
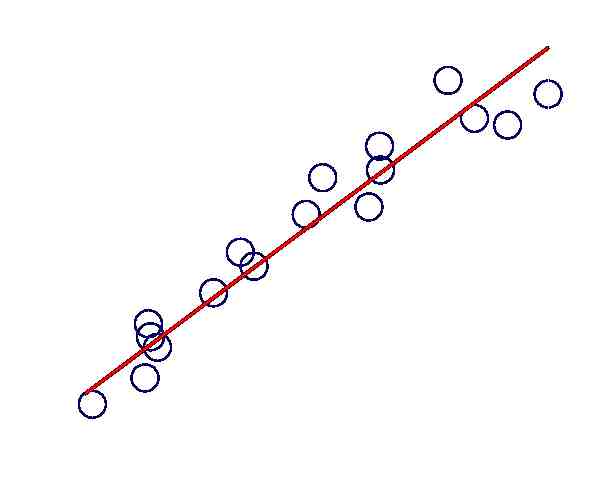
Also, a scatter plot is constructed in order to assess how tight the linear association is between the variables, which gives an indication of how good the linear regression model is.
Is r2 the regression coefficient?
No. Technically, the regression coefficients are the coefficients estimated that are part of the regression model. The r2 coefficient is called the coefficient of determination.
The coefficient r2 is also computed from sample data, but it is not a regression coefficient, but it does not mean it is not important. The r2 coefficient is important because it gives an estimation of the percentage of variation explained by the model.
How to do linear regression in Excel?
Excel has the ability of conducting linear regression by either directly using the commands "=SLOPE()" and "=INTERCEPT()", or by using the Data Analysis menu.
But Excel does not show all the steps like our regression calculator does.
Other calculators related to linear regression
This regression equation calculator is only one among many calculators of interest when dealing with linear models. You may also be interested in computing the correlation coefficient , or to construct a scatter plot with the data provided.
What is the coefficient of determination?
The coefficient of determination , or R^2 is a measurement of the proportion of the variation in the dependent variable that is explained by the independent variable.
For example, assume that we have a coefficient of determination of R^2 = 0.67 when estimating a linear regression of Y as a function of X, then the interpretation is that X explains 67% of the variation in Y.
What happens when you have more variables
You could potentially have more than one independent variable. For example, you may be interested in estimating Y in terms of two variables X1 and X2. In that case, you need to calculate a multiple linear regression model, where the idea is essentially the same: find the hyperplane that minimize the sum of squared errors.


