Bubble Chart Generator
Instructions: Use this online graph generator to get a Bubble chart. Please provide the data for the \((X, Y)\) pairs, and the radius associated to each pair.
The values of \((X, Y)\) and \(r\) need to be numerical data
Please type or paste your data below
More about this Bubble graph generator
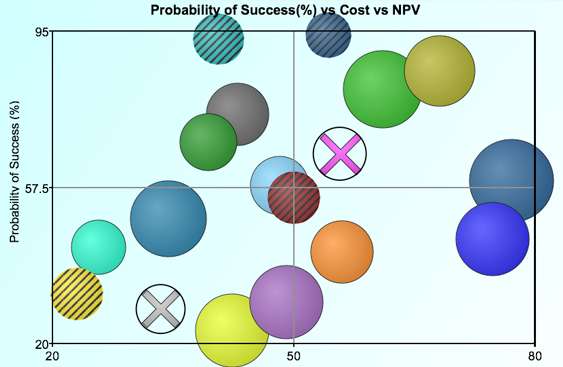
A bubble graph is pretty much like a scatterplot, with the added capability that the "points" in the scatterplot are not points anymore but "bubbles", that have a certain radius, where a larger radius corresponds to a larger bubble.
So it essentially allows you to see the association between two variables X and Y, with an added dimension that each point is actually a bubble to represent something more about the relationship.
Do you create Bubble charts the same way as you create scatterplots?
Pretty much the same way you would do with our scatterplot maker , you need to provide pairs of the form (X, Y).
The only difference for the bubble chart generator is that you need to add a value of \(r\) for each of the pairs (X, Y), in order to represent the size of the bubble .
Other graphic generator of use
You can think of a bubble chart as a generalized scatter plot. Now, often times all you need to assess the relationship betwen two variables X and Y is a regular scatterplot.
But sometimes, it happens that you need to represent an extra dimension of the relationship, and there is where the bubble chart can play an interesting role.
Bubble charts are for interval and ratio variables. For categorical variables you may want to use a bar chart maker , or a pie chart maker or a Pareto chart maker , depending on which aspect of the association you want to highlight.


