Scatter Plot Maker
Instructions : Create a scatter plot using the form below. All you have to do is type your X and Y data (or paste it from Excel) and the scatterplot maker will do the rest. Optionally, you can add a title a name to the axes.
How to Use This Scatter Plot Maker?
More about scatterplots : Scatterplots are bivariate graphical devices. The term "bivariate" means that it is constructed to analyze the type of association between to two interval variables \(X\) and \(Y\). The data need to come in the form of ordered pairs \((X_i, Y_i)\), and those pairs are plotted in a set of Cartesian axes.
Typically, a scatterplot is used to assess whether or not the variables \(X\) and \(Y\) have a linear association, but there could be other types of non-linear associations (quadratic, exponential, etc.). The existence of a linear association is assess by establishing how tightly the data are around a straight line.
Data pairs \((X_i, Y_i)\) that are loosely clustered around a straight line have a weak or non-existing linear association, whereas data pairs \((X_i, Y_i)\) that are tightly clustered around a straight line have a strong linear association. Being able to quickly assess the linear association between two variables is one of the main purposes of using a scatter plot generator.
A numerical (quantitative) way of assessing the degree of linear association for a set of data pairs is by calculating the correlation coefficient .
How do you make a scatter plot?
Student often wonder how can they plot a scatter plot. Typically, a scatterplot will be made using some sort of computational software, like Excel. Usually, the styles and color schemes may change a bit, but in general terms the scatter plot you can make with this grapher looks very similar to those provided by Excel or any other different software package.
If you are going to make a scatter plot by hand, then things are a bit more elaborated: You need to deal with the corresponding x and y axes, and their corresponding scales. Then, you need to identify each pair \((X, Y)\), and locate it on the plane, respecting the corresponding scale defined for each of the axes.
How can you describe the correlation of a scatter plot?
A scatterplot is used to assess the degree of linear association between two variables. The stronger the degree of linear association we see, the closer the absolute value of the correlation will be to 1.
In general terms, by looking at the scatterplot we can estimate the strength of the linear association between the two variables, but to get a precise magnitude, we need to compute the numerical value of the corresponding correlation coefficient.
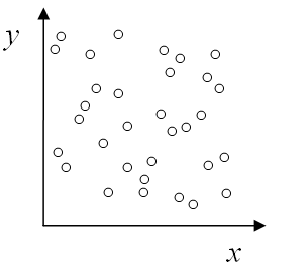
For example, the scatterplot below shows a weak degree of positive linear association, so one would expect the correlation coefficient to be positive but close to zero.
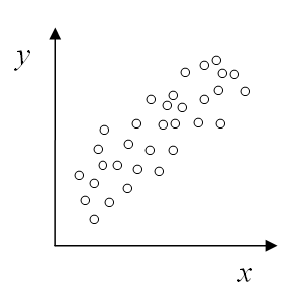
On the other hand, in the scatterplot below we have a moderately strong degree of positive linear association, so one would expect the correlation coefficient to be positive that is relatively close to 1 but not too close.
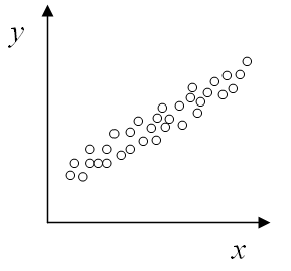
Finally, in the scatterplot below we have a strong degree of positive linear association, so one would expect the correlation coefficient to be positive that is close to 1.
The link between correlation and linear regression
When two variables X and Y exhibit a signficant degree of linear association, then it makes sense to estimate a linear regression model , in order to predict one variable in terms of the other.
In order to estimate a model of the form Y = a + b X + e, a least squares calculators will need to be used. This approach consists of finding the parameters of a line that minimizes the sum of squared errors.
What other graph makers can I use?
Other graph makers that are available in our site are our Pareto chart maker , pie chart maker , ogive graph and bar chart maker , just to mention a few.


