The following figure illustrates a perfectly competitive firm's long run cost curves. a. If the mar
Question: The following figure illustrates a perfectly competitive firm's long run cost curves.
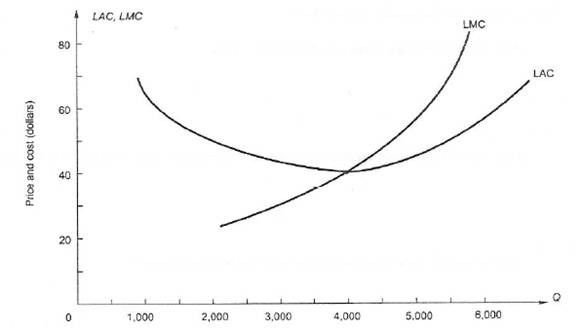
a. If the market price is $70, how many units of output will the firm produce?
b. If the market price is $70, what is the firm's economic profit/loss?
c. To reach the long-run competitive equilibrium from the $70 market price, will the number of firms in the industry increase or decrease? Why?
d. At the long-run competitive equilibrium, what will be the market price?
e. At the long-run competitive equilibrium, how many units of output will the firm produce?
f. At the long-run competitive equilibrium, what is the firm's economic profit/loss?
Price: $2.99
Solution: The solution consists of 2 pages
Solution Format: Word Document
Solution Format: Word Document
-
 [Solved] Consider a monopolist facing the following demand curve and with the following cost curves. a. Draw #17013
-
[Solved] During the sixth month of the fiscal year, the program director of the Westchester Home-Delivered Me #16712
-
[Solved] a) Suppose the cross elasticity of demand for products X and Y is +4.6 and for products E and F is - #5162
-
[Solution] Mitsubishi announced plan to reverse 6% declining sales. Sales fell in North America by 29% due to c #2373
-
Free Math Help
-
Math and Statistics Answers


 Suppose the cross elasticity of demand for products X and Y is +4.6 and for products E and F is - #5162")


