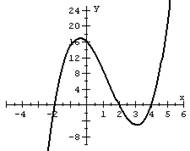
Use the graph of y = f ’(x) to find the intervals where f is increasing, the intervals where f is de
Question: Use the graph of y = f ’(x) to find the intervals where f is increasing, the intervals where f is decreasing, and the local extrema. Also, find the intervals where f is concave up, where f is concave down, and the point(s) of inflection. Sketch a possible graph for y = f(x).
Price: $2.99
Solution: The solution file consists of 2 pages
Deliverable: Word Document
Deliverable: Word Document
-
 to find the intervals where f is increasing, the intervals where f is de #4156") [Solution] Use the graph of y = f ’(x) to find the intervals where f is increasing, the intervals where f is de #4156
[Solution] Use the graph of y = f ’(x) to find the intervals where f is increasing, the intervals where f is de #4156
-
[Solution] Let f(x)=x^3-x^2+3. Use the Second-Derivative Test to determine which critical numbers, if any, give #11294
-
Solution: Determine the limit of the transcendental function, if it exists {theta → 0} lim ( sin 2x)/ #9049
-
Calculus - Other calculus problems #4155
-
Math Help
-
Math and Statistics Answers
 to find the intervals where f is increasing, the intervals where f is de #4156")
=x^3-x^2+3. Use the Second-Derivative Test to determine which critical numbers, if any, give #11294")
/ #9049")


