Use the graph of y = f ’(x) to find the intervals where f is increasing, the intervals where f is de
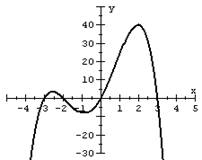
Question: Use the graph of y = f ’(x) to find the intervals where f is increasing, the intervals where f is decreasing, and the local extrema. Also, find the intervals where f is concave up, where f is concave down, and the point(s) of inflection. Sketch a possible graph for y = f(x).
Price: $2.99
Solution: The solution consists of 2 pages
Deliverables: Word Document
Deliverables: Word Document
-
 Find the absolute maximum and absolute minimum, if either exist, for y = f(x) = x3 - 12x + 12, -3 ? #4158") (Solved) Find the absolute maximum and absolute minimum, if either exist, for y = f(x) = x3 - 12x + 12, -3 ? #4158
(Solved) Find the absolute maximum and absolute minimum, if either exist, for y = f(x) = x3 - 12x + 12, -3 ? #4158
-
[Solution] (a) Given f(x)=(7x^2)/(x-1), determine f''(x) (b) x^2y+y^3=2, determine y'' #8782
-
[Solved] A farmer wants to make four identical rectangular enclosures next to his barn, as shown below. If he #20699
-
Solution: Find the derivatives of the given function y=2 cos (3x-π) #28662
-
Math Help
-
Math Solved Problems
 Find the absolute maximum and absolute minimum, if either exist, for y = f(x) = x3 - 12x + 12, -3 ? #4158")
 Given f(x)=(7x^2)/(x-1), determine f''(x) (b) x^2y+y^3=2, determine y'' #8782")

 #28662")

