Five Number Summary Calculator
Instructions: Enter the sample data below and this calculator will provide step-by-step calculation of the Five Number Summary Calculator, using the form below:
Five Number Summary
More about this 5-number summary calculator for you to better understand the step-by-step results provided by this calculator.
How do you calculate the 5 number summary?
The first thing you need to know is what the parts are of a 5 number summary, which is one of the most common techniques used in descriptive statistics.
The five number summary is a set of 5 different descriptive statistics that will give you a quick an accurate view of the distribution of the sample data you are analyzing.
It is calculation is a multi-step process, which involves getting 5 pieces of information. Indeed, for a set of sample of data, the five number summary is a set of 5 numbers that provide a quick perceptive about the shape of a the distribution. The five number summary includes the minimum , the first quartile \((Q_1)\), the median , the third quartile \((Q_3)\), and the maximum .
The five number summary can tell you about the center and the spread of the sample distribution, as well well as the type of skew (if any) and potential outliers.

Steps needed for the 5-number Summary calculation
How to find it will depends on how you want to proceed, and you will see, you have different ways to compute it.
- If you use our calculator, all you need to do is to provide the sample data and the calculator will take of the work, showing you all the steps.
- If you use Excel, you will need to compute each of the components of the 5 number summary separately, as there is no specific function to get them at once. One little thing about Excel though is that it tends to use an oversimplified method for calculating quartiles
- If you do it by hand, you need sort of the data in ascending order. Then, the first number will be the minimum and the last one will be the maximum. The median and quartiles are computing using an interpolation convention for the position of the values in the list.
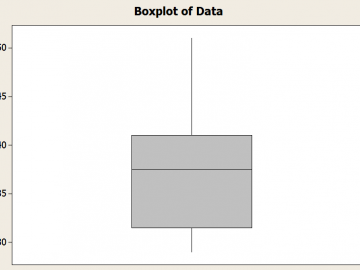
The 5 number summary Box Plot
How are the 5 number summary and the box plot related ?. Well, it is a very tight relation, as the boxplot is essentially constructed BASED on the 5 numbers.
In fact, the lower and upper limits of the box are given by the quartiles Q1 and Q3 , the whiskers are determined by the max and minimum (though there is a cap based on the value of the IQR , using the 1.5 time IQR criterion)
More descriptive Statistics Calculators
You may, on the other hand, be interested in getting a full list of descriptive statistics, which includes the most common measures of central tendency and deviation. In order to do so, you can our step-by-step descriptive statistics calculator
. Also, the 5-number summary plays a crucial role at the construction of the box-plot , which tells you a great deal about the distribution of given sample data, as well as for the detection of outliers .
Summarizing
The 5 number summary is a collection of numbers that help you portrait measures of central tendency and dispersion from some given sample data. The components are:
- The minimum
- The first quartile
- The median
- The third quartile
- The maximum
Five number summary example:
Question : Consider the following sample data: 1, 1, 2, 3, 4, 4, 2, 3, 2, 1, 2, 3, 4, 5, 6, 6, 6, 2, 10, 11. Compute the five-number summary by hand, showing all the calculations.
Solution:
These are the sample data that have been provided with:
| Observation | \(X\) |
| 1 | 1 |
| 2 | 1 |
| 3 | 2 |
| 4 | 3 |
| 5 | 4 |
| 6 | 4 |
| 7 | 2 |
| 8 | 3 |
| 9 | 2 |
| 10 | 1 |
| 11 | 2 |
| 12 | 3 |
| 13 | 4 |
| 14 | 5 |
| 15 | 6 |
| 16 | 6 |
| 17 | 6 |
| 18 | 2 |
| 19 | 10 |
| 20 | 11 |
These are the sample data that have been provided with:
| Position | \(X\) (Asc. Order) |
| 1 | 1 |
| 2 | 1 |
| 3 | 1 |
| 4 | 2 |
| 5 | 2 |
| 6 | 2 |
| 7 | 2 |
| 8 | 2 |
| 9 | 3 |
| 10 | 3 |
| 11 | 3 |
| 12 | 4 |
| 13 | 4 |
| 14 | 4 |
| 15 | 5 |
| 16 | 6 |
| 17 | 6 |
| 18 | 6 |
| 19 | 10 |
| 20 | 11 |
Based on the table above, the minimum is \(\min = 1\) and the maximum is \(\max = 11\). Now the position of the first quartile \(Q_1\) is:
\[ L_{25} = \frac{25}{100} \times (n+1) = 0.25 \times 21 = 5.25 \]Since \( L_{25} = 5.25\) is not an integer number, the first quartile \(Q_1\) is computed by interpolating between the values located in the \(5^{th}\) and \(6^{th}\) positions, as shown in the formula below:
\[ Q_1 = 2 + (5.25 - 5)\times (2 - 2) = 2\]Since the sample size \(n = 20\) is even, we have that \((n+1)/2 = (20+1)/2 = 10.5\) is not an integer value, so the median is computed directly by finding the average of the values located at positions \(10^{th}\) and \(11^{th}\), which is:
\[ median = \displaystyle \frac{3 + 3}{2} = 3.5\]Now the position of the third quartile \(Q_3\) is:
\[ L_{75} = \frac{75}{100} \times (n+1) = 0.75 \times 21 = 15.75 \]Since \( L_{75} = 15.75\) is not an integer number, the third quartile \(Q_3\) is computed by interpolating between the values located in the \(15^{th}\) and \(16^{th}\) positions, as shown in the formula below:
\[ Q_3 = 5 + (15.75 - 15)\times (6 - 5) = 5.75\]Therefore, based on the results found above, we get the following five-number summary:
| Minimum = | \(1\) |
| \(Q_1\) = | \(2\) |
| Median = | \(3.5\) |
| \(Q_3\) = | \(5.75\) |
| Maximum = | \(11\) |

