Exponential Regression Calculator
Instructions : Use this tool to conduct an exponential regression. What you need to do is type or paste your \(X\) and \(Y\) paired data and a scatterplot with and exponential regression curve will be constructed. If you wish, you have the option of adding a title and a name to the axes.
About this Exponential Regression Calculator
Scatter plots are used to assess the type of association between an independent variable \(X\) and a dependent variable \(Y\). Usually, along with a scatter plot a straight line, call the regression line is drawn too.
Moreover, regardless of the degree of linear association between the variables, the regression line is usually added, regardless. This could be misleading at times when the data does not follow a linear pattern and they follow instead some kind of a non-linear pattern, being the exponential pattern a commonly found one.
How do you calculate exponential regression?
First, you need to have data pairs of the form \((X_i, Y_i)\). Normally, when these data are at least loosely clustered around a straight line, a linear regression model is calculated by computing its coefficients via the Least Squares method.
Now, sometimes the data does not follow a linear pattern, and specifically, there is a rapid growth pattern in the dependent variable \(Y\) when the values of the independent variable \(X\) grow.
When that happens, you also use the Least Squares technique to compute the coefficients of the exponential model, only that instead of applying on \(X\)'s and \(Y\), you do a little trick and apply to the logarithms of \(X\)'s and \(Y\)'s.
How can you do exponential regression by hand?
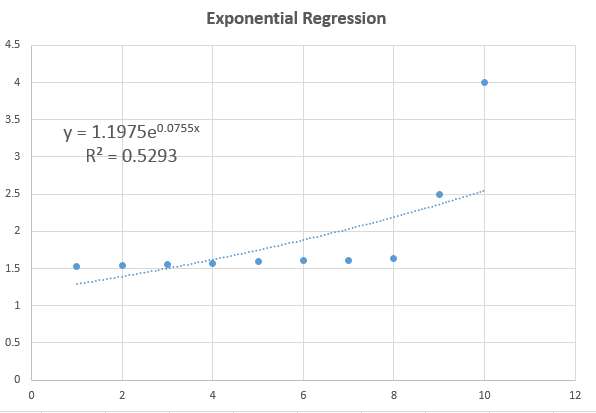
Actually, it is not recommended. Both the graphing of a scatterplot , calculation of model parameters, using the exponential regression formula and graphing of the exponential model required a good bit of mathematical calculations, for which reasons is very difficult to be done by hand. The formula of the model is
\[ Y = a e^{b x} + \varepsilon \]It is highly recommended to use an online stats calculator like this one, or otherwise Excel or your favorite scientific calculator, but the "by hand option" is pretty much off the table.
Is exponential regression linear?
No, it is not. Exponential model start growing more rapidly as \(X\) increases, whereas linear model grow at the same pace as \(X\) increases.
What is the difference between power regression and exponential regression?
There is a structural difference. Indeed, in an exponential model, the "X" appears as the exponent in the model, whereas in the power regression the "X" appears in the base, which leads to a much faster growth rate for larger values of \(X\) for the exponential model.
What other graph tools can I use?
You can use other graph makers for different circumstances. For example, if you suspect or know that a linear regression is appropriate, then you can use this scatter plot maker along with a linear regression calculator .
On the other hand, observe that if you there is absence of a linear pattern because the grow pace does not seem to be constant as X increases, it could be but it does not necessarily have to be an exponential model, because it can also be a power regression model or a polynomial regression model


