C-Chart Maker
Instructions: Use our step-by-step c-chart maker, by providing your samples, with the number of defectives for each sample.
Learn more about this C-Chart grapher.
This C-chart calculator is used as a graphical tool to assess if a process is in statistical control, usually in the context of analyzing the behavior of non-conforming items in successive samples.
Using a graphical tool allow you to detect abnormalities very quickly, by simply seeing what points in the graph appear to be extreme with respect to the rest of the points. This deviance is measured by whether or not any point goes beyond the control limits.
How do I use this C chart calculator online?
You want to analyze a list of \(N\) samples, and for each of the samples you have a certain number of non-conforming items
From that you can find the average number of non-conforming per sample, \(\bar{c}\).
Then, you can use the following formulas to get the lower and upper control limits for the c-chart
\[ LCL_{c} =\bar{c} - 3\sqrt{\bar{c}} \] \[ UCL_{c} =\bar{c} + 3\sqrt{\bar{c}} \]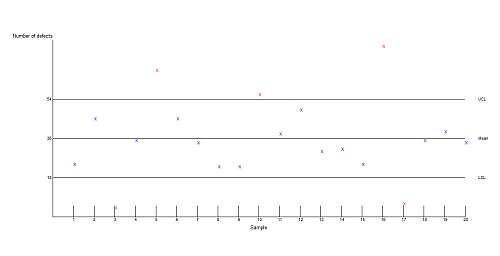
Step-by-Step: How do you make a C-chart?
1. First, you conduct the data collection for the data you want to measure/study. In this case, you are interested about non-conforming items within batches (samples).
2. Then, after the data collection is completed, you need to get the count of non-conforming items on each sample.
3. In this step, you compute the average of all the non-conforming/defectives found in each of the samples.
4. Next, you have to compute the the lower and upper control limits using the formulas \(LCL_{c} =\bar{c} - 3\sqrt{\bar{c}} \) and \(UCL_{c} =\bar{c} + 3\sqrt{\bar{c}} \).
5. The you will use a chart in which you will construct a line to plot each non-conforming (defective) value for each sample. Also, you will plot lines for the lower and upper limits, and for the centerline as well.
6. Finally, you determine whether or not any sample has a non-conforming number that go beyond the lower or upper control limits.
The points that go beyond the lower or upper control control limits are said to be out of statistical control. When you have no points that go beyond the control limits, then it is said that the process is in statistical control.
Other control chart
Each type of control chart is intended to measure a certain attribute of a process. For example the R chart is used to assess whether or not the variability in a process is in control. Also, you can use a X-bar chart maker . if you need to assess whether the center of the process is in statistical control .


