Two Lines Grapher
Instructions: Use this graphing tool to plot the graph of two lines that you provide. Please type two linear equations.
More about this two lines graphing tool
A line is a simple geometric figure, but it has lots of applications, especially when used jointly with other lines.
For example, one can graph two lines, and find that these lines intersect at a certain point \((x*, y*)\). So, graphically we have an intersection between the two lines, but algebraically, the intersection point corresponds to a solution to a system of linear equations .
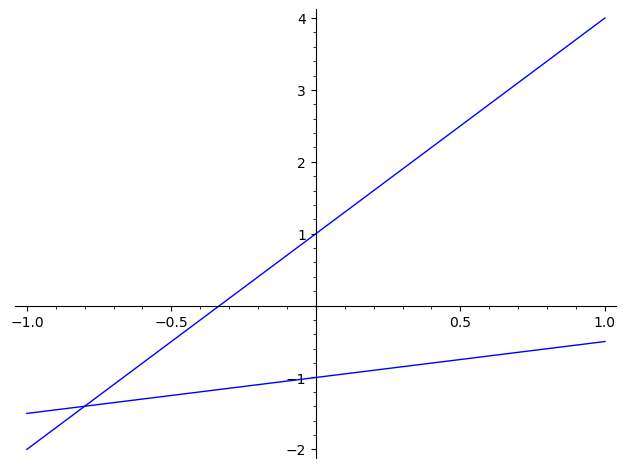
How do you graph two lines?
The easiest way to do it is to find the slope intercept form for each of the line, and graph them using that. The slope-intercept form tells you all you need to know about the line: its slope, and the point where it crosses the y-axis.
Naturally, with the equation of the line, you could possible get the x-intercept and y-intercept for each the lines, and use them as guiding points to graph the lines.
How do you plot two lines on the same graph?
That depends on the platform you are using. Most calculators by default will plot one line on a graph, unless you specify differently. For this calculator, the two lines are automatically placed on the same graph.
Eventually, you would want to graph one line only, or graph a general function that is not linear.


