T-Distribution Probability Calculator
Instructions: Use this T-Distribution Probability Calculator to Compute t-distribution probabilities using the form below. Please type the number of degrees of freedom associated to the t-distribution, and provide details about the event you want to compute the probability for:
More about the t distribution probability
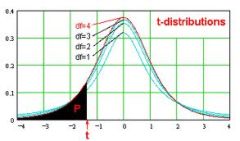
The t-distribution is a type of continuous probability distribution that takes random values on the whole real line. The main properties of the t-distribution are:
- It is continuous (and as a consequence, the probability of getting any single, specific outcome is zero)
- It is "bell shaped", in the same way the normal curves are bell-shaped
- It is determined by one parameter: the number of degrees of freedom (df). For one sample, the number of degrees of freedom is df = n - 1, where n is the sample size
- It is symmetric with respect to 0
- The t-distribution "converges" to the standard normal distribution as the number of degrees of freedom (df) converges to infinity (+∞)
In order to compute probabilities associated to the t-distribution we can either use specialized software such as Excel, etc, or we can use t-distribution tables (normally available at college statistics textbooks. The use of the t-distribution arises when performing hypothesis testing (for the case when the population standard deviation is not known).
How do you this this t-distribution calculator
This calculator allows you have both a T distribution calculator for two tailed, as well as for left-tailed and two-tailed. This is achieved by selecting the right type of event in the form above.
What is the meaning Area of t distribution calculator
The are of the t-distribution, the same as all probability distributions, represents the probability that a random even occurs in the region for which the area is computed. In other words, in this case Area = Probability.
What is the T distribution calculator accuracy
It really depends on which tool do you use to do the calculation. For example, if you use t-tables to compute t-distribution probabilities, you will find that those typically have accuracy of 4 digits.
Now, when you use our calculator (or Excel), you get about 15 digits accuracy. You may think that is great and it is better, and it actually is, only you have to be carefully when answering tests and quizzes, where they may want you to round intermediate and final steps, which could lead to answers that can be different than the answer expected by the system.
More calculators related to the t-distribution
This is calculator for the T-Distribution. If you need to work with the normal distribution, you may be also interested in our z-distribution calculator . Also, a normal probability for samples could come in handy to deal with things like the Central Limit Theorem and things like that.
Application: Calculation of a probability
Question : Compute the probability of the event (-1, 0.8) for the t-distribution with 34 degrees of freedom.
Solution:
We need to compute \(\Pr(-1 \leq T \leq 0.8)\), where \(T\) has a t-distribution with \(df = 34\) degrees of freedom. Therefore, the probability is computed as:
\[ \begin{array}{ccl} \Pr(-1 \le T \le 0.8) & = & \Pr(T \le 0.8) - \Pr(T \le -1) \\\\ \\\\ & = & 0.7854 - 0.1622 \\\\ \\\\ & = & 0.6232 \end{array}\]Therefore, based on the information provided, it is concluded that \( \Pr(-1 \leq T \leq 0.8) = 0.6232\)


