Table 1 (see below) is from an article by Batiuk, Lahm, McKeever, Wilcox, and Wilcox (2005) entitled
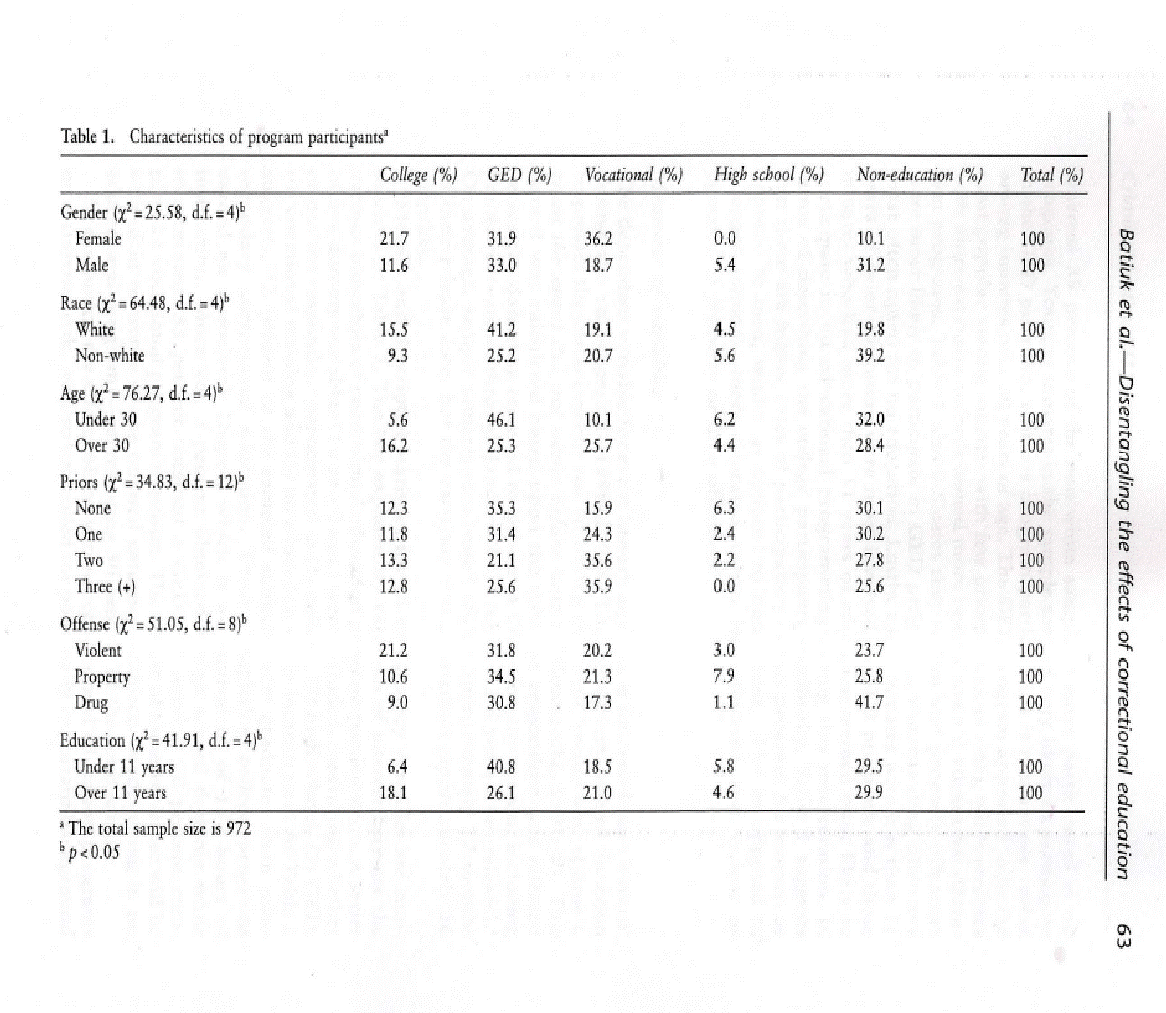
Question: Table 1 (see below) is from an article by Batiuk, Lahm, McKeever, Wilcox, and Wilcox (2005) entitled, “Disentangling the effects of correctional education: Are current policies misguided? An event history analysis,” published in Criminal Justice, 5(1): 55-74.
In this table, the authors are describing the characteristics (e.g., gender, race) of the sample of Ohio inmates who completed the various correctional educational programs included in their study (e.g., college, GED) and those who did not participate in correlational educational programs (e.g., non-education). A total of 972 inmates who were paroled or released from Ohio’s prisons from 1989 and 1992 comprised the sample.
a. What statistical test did the authors use to test if there are any statistical significant differences between the various background characteristics of the inmates and participation in correctional education program?
|
Gender (χ2=25.58, d.f.=4)b p<0.05 |
College(%) | GED(%) | Vocational(%) | High School(%) | Non-Educational(%) | Total(%) |
| Male | 11.6 | 33.0 | 18.7 | 5.4 | 31.2 | 100 |
| Female | 21.7 | 31.9 | 36.2 | 0.0 | 10.1 | 100 |
c. Is the type of offense of inmate committed related to the type of education he/she participated in? Provide empirical evidence from the table AND evidence from the statistical test.
d. Overall, describe the statistically significant characteristics of those inmates who have higher rates of participation in the college program. Simply put, what do these inmates look like?
Deliverable: Word Document

-
 from Schreck, Fisher and Miller’s arti #28503") [Solution] Look at the correlation matrix presented Appendix (see below) from Schreck, Fisher and Miller’s arti #28503
[Solution] Look at the correlation matrix presented Appendix (see below) from Schreck, Fisher and Miller’s arti #28503
-
[Solution] The Carolina Tobacco Company advertised that its best-selling non-filtered cigarettes contain 40 mg #21138
-
[Solved] A researcher is investigating the effectiveness of a new study-skills training program for elementar #24932
-
(Solved) Exercise 3. The results of a sample survey of 20 patients yielded the following paired observations: #25339
-
Math Solutions
-
Step-by-Step Math Solutions
 from Schreck, Fisher and Miller’s arti #28503")


 Exercise 3. The results of a sample survey of 20 patients yielded the following paired observations: #25339")

