Costs a. Given the following chart and information fill in the missing values. Please write on a sep
Question: Costs
a. Given the following chart and information fill in the missing values. Please write on a separate sheet.
| Output | TFC | TVC | TC | MC | AFC | AVC | ATC |
| 0 | $2,000 | -- | |||||
| 50 | 100 | ||||||
| 100 | 80 | ||||||
| 150 | 60 | ||||||
| 200 | 50 | ||||||
| 250 | 60 | ||||||
| 300 | 85 | ||||||
| 350 | 125 |
b. Please graph your results. Draw both the average and total cases making sure to explain each as well as explain any important relationships or trends in the curves.
c. In general explain how we get at LRAC curve. Please show with 3-4 ATC curves how it is formed and why it is u-shaped in general.
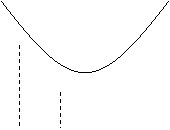
d. In a new LRAC graph explain how a firm would choose to produce two levels of Q, with Q↓ if we consider that we are going from two points both on the upward sloping portion of the LRAC.
Hint: Use an illustration like the one below but start and finish on the upward sloping portion of the graph:
 | |||||
 | |||||
|
Price: $2.99
Answer: The solution consists of 6 pages
Deliverable: Word Document
Deliverable: Word Document
-
 [Solved] Markets and Market Structure Given the following graphs and information answer the following questio #27178
-
[Solution] Consider an economy that produces only three types of fruit: apples, organs, and bananas. In the bas #5917
-
[Solution] Suppose you form a portfolio consisting of a stock and a risk free asset. (i.e. Treasury Bill). Yo #5273
-
(See Solution) If total cost is given by TC = 10Q ? 5Q2 + 0.1Q3, where Q is the level of output. (a) Obtain the mar #29049
-
Math Help
-
Math Solutions


. Yo #5273")
 If total cost is given by TC = 10Q ? 5Q2 + 0.1Q3, where Q is the level of output. (a) Obtain the mar #29049")

