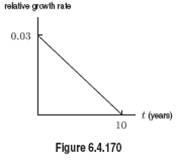
Solution) A graph of the relative growth rate of a population is given in Figure 6.4.170. By approximately wha
Question: A graph of the relative growth rate of a population is given in Figure 6.4.170. By approximately what percentage does the population change over the 10 year period?
Price: $2.99
Solution: The downloadable solution consists of 1 page
Solution Format: Word Document
Solution Format: Word Document
-
t, where P0 is the price in do #1471") [Solved] With a yearly rate of 3 percent, prices are described as P = P0 (1.03)t, where P0 is the price in do #1471
[Solved] With a yearly rate of 3 percent, prices are described as P = P0 (1.03)t, where P0 is the price in do #1471
-
[Solution] Find the area of the region bounded by the graphs. , , , and #21737
-
Calculus - Other calculus problems #1470
-
[Solution] The two-dimensional heat equation for an insulated thin plate is: du/dt = k (d2u/dx^2 + d2u/dy2) . S #14715
-
Math and Statistics Calculator
-
Math and Statistics Answers
t, where P0 is the price in do #1471")


 . S #14715")

