[Solution] The data given in the text file algae.Xpos.txt are the - #80096
The data given in the text file algae.Xpos.txt are the results of a toxicity experiment. Algae growth Y (cellsx104/ml) in Petri dishes was measured after a period of exposure to X = Cadmium Chloride (mg/l = micrograms/liter). Three dishes were randomly assigned to receive each of the doses X = 5, 10, 20, 40, and 80 mg/l.

a. Fit a simple linear regression modeling Y vs. X. Assess the formal model assumptions critically. Give me the main Minitab regression output page, and tell me what assumption checks you inspected and tell me what you saw in each check. Note that the original time order of the observations is not available. The two tables below are provided to guide you and help you organize your answer
|
Plot/test |
Interpretation / comments |
|
Preplot of Y vs. X |
|
|
Plot of Resids vs. Preds |
|
|
Residual histogram |
|
|
Tests of normality |
|
|
Normal Plot of resids. |
Conclusions regarding validity of model assumptions
|
Assumption |
Comments |
|
0 (X’s measured with negl. error) |
|
|
1 (model correctly specified) |
|
|
2 (constant error variance) |
|
|
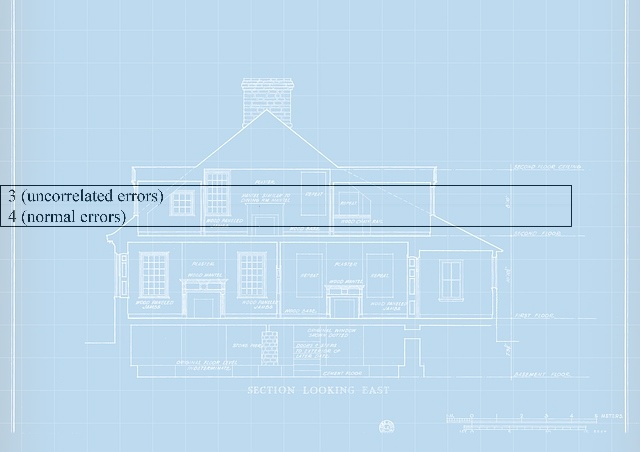
3 (uncorrelated errors) |
|
|
4 (normal errors) |
b. If we consider a Box-Cox analysis of both Y and X, here, what transformations are suggested? Give a plot to support your answer.
c. Refit the SLR model on transformed Y and/or X using simplified versions of the Box-Cox recommended transformations from part (b), i.e. use log10 if l or a are close to 0, square root if they are close to ½ , etc.; critique assumptions again as in (a).
d. Ignoring any concerns you may have with assumptions for the model you chose in part (c), back transform its results as follows: calculate predicted values and 90% prediction intervals for Ynew at each of the cadmium chloride values from 5 to 80 by increments of 5. Construct a thesis-quality plot showing these predicted values and intervals as curves (not plotted points) vs. the X-values. Label your plot for inclusion in a thesis or publication.
Deliverable: Word Document
 and pdf
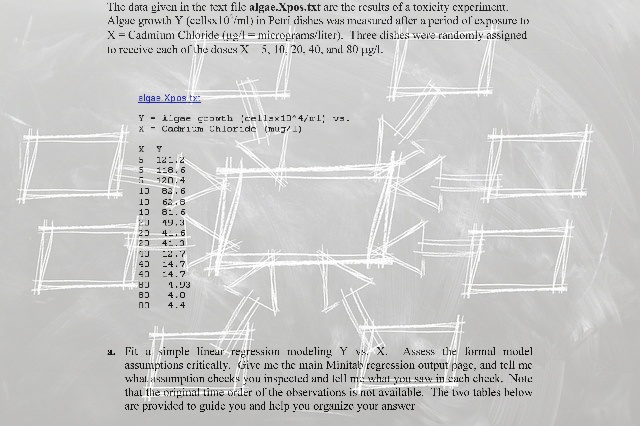
 16. The probability of two kings of any suit and three queens of any suit. - #80146")

 You collect the following salary figures for Master’s - #80086")
