(Solution) You collect the following salary figures for Master’s - #80086
Statistics Problems:
Please answer all questions with explanations.
You collect the following salary figures for Master’s Level Students and their salaries after 2 years at work. You are interested in whether or not people with different degrees make more or less money. The data are analyzed using an ANOVA test with the following results:
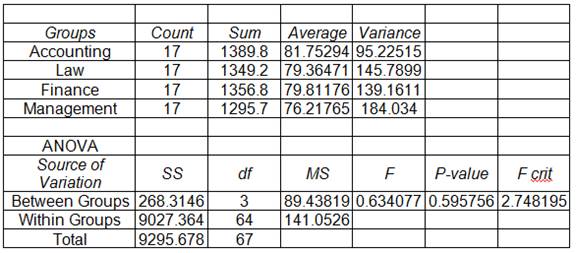
1.) What are the null and experimental hypotheses?
2.) Is there a significant difference between the four majors with regard to their salaries 2 years after graduation?
3.) Consider a situation where the ANOVA showed that there WAS NOT a significant difference between the four majors. What would you recommend doing as a next step in the research to show that people with Accounting degrees make significantly more than graduates with Management-degrees?
4.) Consider a situation where the ANOVA showed that there WAS a significant difference between the four majors. A Tukey Critical Difference was calculated to be 4.8 for these data at 95% confidence. What does this statistic tell you about the data?
5.) Why would it be better to use a one-tailed test in this case?
6.) You selected a one-tailed test, what are the null and experimental hypotheses (H0 and H1)?
7.) In the beer price study, what is the critical value of t used in a one-tailed test?
8.) Is there a significant difference between the price of domestic versus imported beers? What does this mean?
Descriptive statistics for both prices of beers were calculated. The results showed the following:
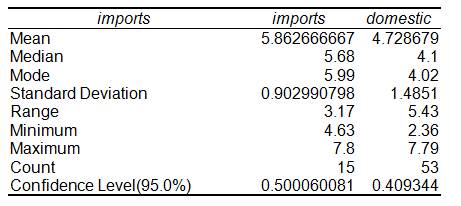
9.) What is the one BEST measure of central tendency (mean, median, or mode) to use for these data?
You are interested in the prediction of apartment rent from square footage. You sample 25 apartments in the Glendale area and record the apartment rent costs and square footage. When you put this into Excel, you get the following output:
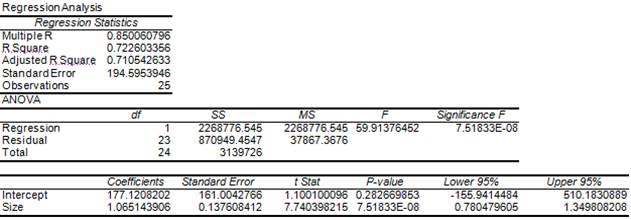
10.) What is the regression equation for these data?
11.) How much of the variance in rent can be predicted by knowing the square footage?
12.) Is this a significant regression equation?
13.) What does this mean?
14).What percent of workers make less than $10.50 per hour (z = -1.00)?
15). What percent of workers make more than $15 per hour (z = 2.21)?
Deliverable: Word Document
 and pdf
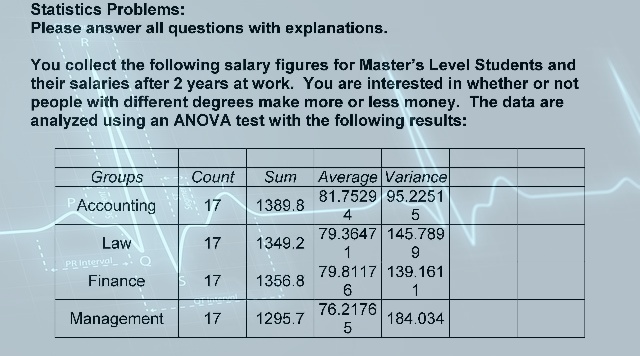

 Identify a research issue, problem, or opportunity facing - #80174")
 Work through a t-test to compare the means of two groups - #80175")
