[Solved] You should also save the Baseball Salaries spreadsheet - #80070
You should also save the Baseball Salaries spreadsheet to your computer and use it to submit your answers to the questions below. Put your data answers (Questions 1-3) in the first sheet and then work the problems directly in the workbook for the remaining questions on measures.
Use the appropriate Excel statistical functions to help you with your calculations. You may want to use the “Calculations” worksheet to do those calculations involving more than one team’s data. Also note that each Excel function has its own help operation; so if you have difficulty with any function, use its help capability to explain how the function works.
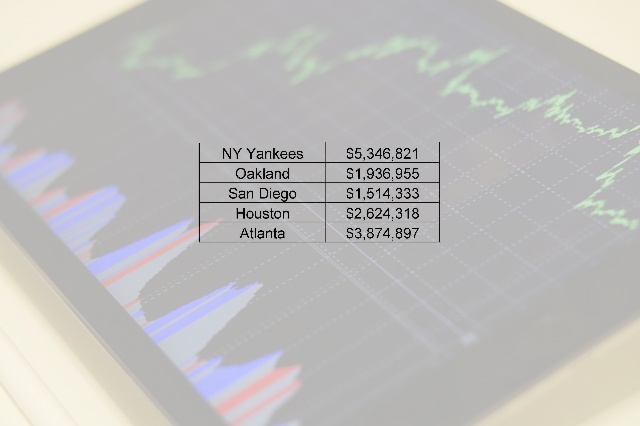
2. What are the ranges of quantitative data (salary ranges) for each team listed in the Baseball Salaries spreadsheet below? (Hint: A range implies interval with a beginning and an end; so you will need at least two numbers to specify each range.)
3. Use MS Excel and information from the Baseball Salaries spreadsheet below to create a single meaningful frequency distribution table with at least 5 separate categories.
4. For each baseball team listed in the workbook, compute the mean, mode, and median salaries. (Warning: Excel’s mode function is not a good one. It will pick out only one mode even though there might be several in a given team’s data. Use your eyeball to spot all the modes.)
5. For each team, what is the probability that each team will pay a player $1,000,000 or more? (Hint: What constitutes the numerator (number of successes) and what constitutes the denominator (number of trials) in the probability equation for each team?)
6. If you had to pick one player at random from each of two different teams, what is the probability that they would both be paid $1,000,000 or more? (Tell me which two teams you picked.) (Hint: This is asking for the probability that one player picked from one given team will be paid $1,000,000 or more, AND that one player picked from another given team will also earn that amount.)
7. What is the standard deviation between the average salaries for all the different teams? (Hint: Use the Excel function STDEV on the means (averages) you calculated in question 4 as the data. You will have to set up an array of the means for all the teams to work this.)
Deliverable: Word Document
 and pdf

 - #80173")
 A short descriptive title of your report.")
