Solution: For this problem, a MAXIMUM of 2 typed answer sheet(s) - #80173
For this problem, a MAXIMUM of 2 typed answer sheet(s) should be prepared. This sheet or sheets will have your name, student number, section time all at the right hand top of the sheet. Your answers should be typed on these sheets. An answer is NOT: “see page 4 of the appendix”. If, for example, a forecast for year 7 quarter 1 is requested, the forecast value should be on the answer sheet. You may cut and paste from your computer output to the first sheet or you may retype the values. Do not simply refer to your answers on various sheets that have the computer output. You will not receive credit! Do not intersperse computer output and answers!!!!!! All answers should be on the two answer sheets and you should refer in your answers to various pages in the computer output section from whence you obtained the answer as backup and as a way to show the work involved in the answer given on the answer sheets.. In referring to computer output you may wish to say: “See page 3(*)” after you have typed the actual answer on the typed answer sheet. Then on page 3 place an (*) at the location to which you are referring. Each page should be numbered. In essence, the computer output will be treated as an appendix. Staple the answer sheet(s) and computer output (for this problem only) together. Answers printed in the appendix but not on the two answer sheets will not receive credit!!!!
The answers should be typed (on the first sheet) in prose format where appropriate with enough detail so that referral to the appendix is not required. You may write down in ink any mathematical equations or results (as opposed to typing them)
The exam is due one week from today at the beginning of class time at 209 CCB. Exams turned in late will be assessed a penalty of 20 points for each day (or portion thereof) late. Thus if the exam is turned in late anytime up to 24 hours late, you would lose 20 of 75 points. If it is turned in more than 24 hours late, you would lose 40 of 75 points.
IF YOU NEGLECT TO MAKE THE CHANGES TO THE OBSERVATIONS OR IN THE ADDITION OF AN OBSERVATION PER THE INSTRUCTIONS ABOVE, 30 (OF 75) POINTS WILL BE DEDUCTED FROM YOUR SCORE.
Be sure when running regressions, to click on the label box if you use EXCEL and to include the label row in defining the independent and dependent variables. Be sure to write out each regression equation that is part of your final answer in terms of the labels. Thus instead of typing “ y=5+6x”, you should type” sales=5+6time” where y is defined to be the dependent variable “sales” and x is the independent variable “time”. Make sure that the number of observations printed in EXCEL is the same as that in the problem dataset. If not, you have an input error probably involving the "label" box.
The use of Minitab for portions of this problem is recommended.
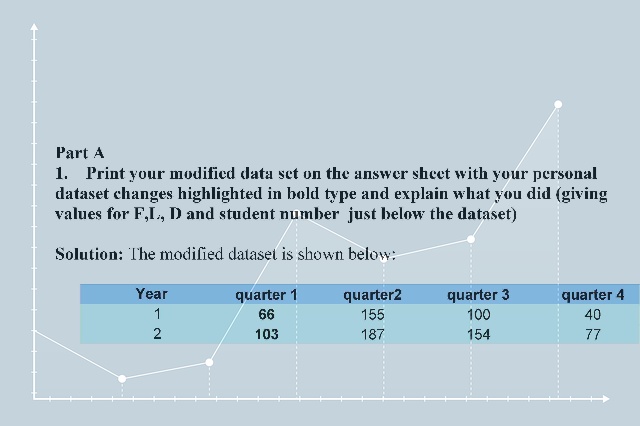
Part A
1. Print your modified data set on the answer sheet with your personal dataset changes highlighted in bold type and explain what you did (giving values for F,L, D and student number just below the dataset)
2. You may now wish to modify the dataset into two columns. The first column showing the year and quarter and the second column showing the sales for that period. You may also wish to generate a third column with the numbers 1 through 24 to denote the index number for each sales value.
Part B
3. Generate seasonal indexes for the four quarters using the method outlined in the text in Chapter 18-4 and/or in the excel spreadsheet for problem 26 of Chapter 18. This is available on mygateway. The seasonal indexes should be formatted to show 6 decimal places.
4. Adjust the seasonal indexes generated so that the 4 indexes add to a total of 4.000000 (to six decimal places).
5. Generate a scatterplot of your modified dataset and also generate a scatterplot of your seasonally adjusted dataset.
6. Generate a simple linear regression of the form: (seasonally adjusted sales)= b0 +b1(time) where time is from 1 through 24. Note the regression must use seasonally adjusted sales, not the sales of your modified dataset.
7. Prepare deseasonalized forecasts for year 7 quarters 1,2,3 and 4.
8. Seasonalize your forecasts from #7 above.
Part C
9. Return to the dataset as given in Part A, step 2. Generate 3 dummy 0-1 indicator variables in order to define the individual seasons. Write the definition for seasons 1,2,3, and 4 in terms of the three dummy 0-1 indicator variables, S1, S2, S3. (Do not use the seasonalized dataset from Part B).
10. Generate a multiple regression of the form sales= b0 +b1(time)+ b2(S1) +b3(S2) +b4(S3). Comment on the suitability of the regression model by analyzing the F statistic, the 4 p-values for the coefficients b1,b2,b3,b4. Also review the residuals, outliers, residual plots, etc. Interpret the meaning of coefficients b2,b3 and b4.
11. Calculate the Durbin Watson statistic. Is autocorrelation (positive or negative) present?
12. Prepare forecasts for year 7 quarters 1,2,3 and 4.
Part D
13. Use double exponential smoothing (easiest in Minitab). Run with alpha =.2 and a value of .1 for trend. Note that in minitab under double exponential smoothing the term “level” is used for alpha and “trend” for trend. Generate forecasts for year 7 quarters 1,2,3 and 4.
14. Suppose sales data for year 7 quarters 1,2,3 and 4 are 262, 392, 321, and 305 respectively. Compare your forecasts from 8,12, and 13 by using mean absolute error. Which method is the best? Now compare your forecasts from 8,12, and 13 by using mean squared error. Which method is the best? Finally, compare your forecasts from 8,12, and 13 by using mean absolute percentage error. Which method is the best?
Deliverable: Word Document
 and pdf
 Frito Company was founded in 1932 in San Antonio, Texas, - #80015")
 Following is a problem description. Use the mean & variance - #80041")

