Mean and Standard Deviation Calculator
Instructions: Use this Mean and Standard Deviation Calculator by entering the sample data below and the solver will provide step-by-step calculation of the sample mean, variance and standard deviation. Please type the sample data or paste it from Excel.
More About Descriptive Statistics: Using this Mean Calculator
Descriptive Statistics corresponds to measures and charts that are derived from sample data and are intended to provide information about the population being studied. Two basic types of descriptive statistics are the measures of central tendency and the measures of dispersion .
How to calculate the mean?
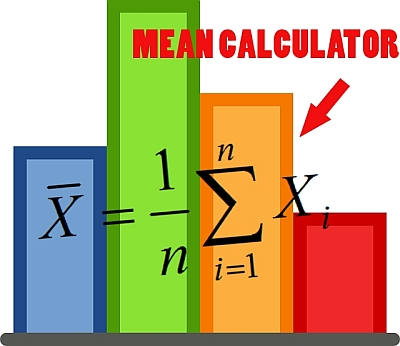
To compute the sample mean, you need to use the following formula:
\[ \bar X = \displaystyle \frac{1}{n} \sum_{i=1}^n X_i \]In simple terms, you divide the sum of all the values in the sample by the total number of values in the sample.
How to use this Mean Calculator
In order to calculate the mean from a sample, you need to follow these steps:
- Step 1 : Identify clearly the sample you are wanting to analyze and compute the mean, and ensure that all values are numeric, otherwise you cannot continue
- Step 2 : If you are only calculating the mean, then you don't need to sort the data. But if you also want to calculate the median and percentiles , you will need to sort the data in ascending order
- Step 3 : Calculate the number of values in the sample n, also known as the sample size, and calculate the sum of the sample
- Step 4 : The sample mean is calculated by dividing the sum of the data by the sample size
So in order to find the mean, you just need to compute the average of the data.
The mean is one of the most commonly used measures of central tendency, and for good reason. We know that for a sufficiently large sample size the sample mean will be numerically close to the population mean.
In technical terms (I lost you there, I know), the sample mean is an unbiased point estimate of the population mean.
This mean calculator will show you all the steps of the process and all you need to do is to type or paste from Excel the sample data you want to work with.
On top of that, you also get the steps for computing the standard deviation, giving you a good picture of the most important descriptive statistics you need to get started.
Measures of Central Tendency
The measures of central tendency intend to give an idea of the location of the distribution. Examples of central tendency measures are the sample mean \(\bar X\), the median and the mode.
Notice that the sample mean is the same as the average of the data. In the context of statistics though, the most commonly used name is sample mean.
Measures of Dispersion
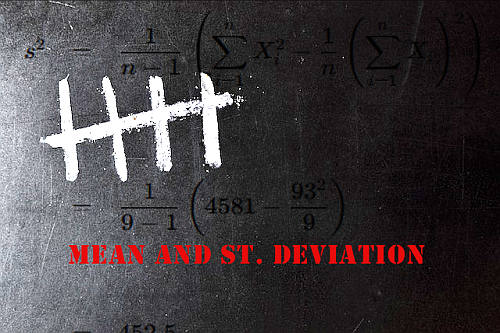
Examples of measures of dispersion are the variance \(s^2\), the standard deviation \(s\), and the range among others. Different measures are more appropriate than others for certain cases.
For example, certain measures like the mean are very sensitive to outliers , and therefore, when a sample has strong outliers or it is very skewed, the preferred measure of central tendency would be the median instead of the sample mean
If you want to conduct a more more complete and thorough analysis, use our descriptive statistics calculator .
Properties of the mean and standard deviation
One excellent property of the sample mean is that is an unbiased estimator of the population mean, and that has the property that if we choose a sample size relatively large, we know the numerical value of the sample mean obtained is close to actual population mean.
The sample standard deviation, on the other hand, is not an unbiased estimate of the population standard deviation, but still, the numerical value of the sample standard deviation will be close to the true population standard deviation for a large sample size.
Other kinds of means
The sample mean, which is based on the average of sample data is not the only kind of "mean" that you can conceive of, as you can also compute the harmonic mean and the geometric mean , which also attempt to find a representative element of a sample, but using a different numerical approach.
Finding a representative value of a sample really depends on the shape of the distribution. For skewed distributions will better off computing the median or the mode , as skewed distributions will tend to over-represented the skewed tail when computing the mean.
More Tools
There are lot of resources online that you can explore, for example EssayMarket, that can help make your life easier if you need help with a paper.

