If you are given that the dependent variable (y) is Annual Sales, and x_1 is the number of jobs held
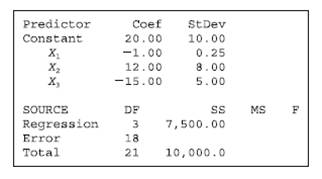
Question: If you are given that the dependent variable (y) is Annual Sales, and \[{{x}_{1}}\] is the number of jobs held by each member of the sales staff within the past 5 year period, \[{{x}_{2}}\] is the years of experience of each staff member and \[{{x}_{3}}\] is the number of glasses of wine each staff member drinks at lunch. Interpret the coefficients and the standard deviations for the following table for predictors \[{{x}_{1}}\], \[{{x}_{2}}\] and \[{{x}_{3}}\]. Suppose the printout displayed \[{{R}^{2}}=.31\]. What does that tell you? What can you say about a sales staff with regard to sales in general from these results?
Price: $2.99
Solution: The solution file consists of 2 pages
Deliverable: Word Document
Deliverable: Word Document
-
 [Solved] Consider the following data collected over the past 12 months representing artificial membrane produ #5621
-
[Solution] If A = {0, 3}, B = {2.7}, with μ = R, determine each of the following: a) A∪ B b) A#772; c #4103
-
[Solved] The data below are the numbers of hours of homework done as reported by 24 high school juniors for t #27879
-
[Solution] The following sample observations were randomly selected. Determine the value of ‘r”. Interpret your #26261
-
Math Homework Help
-
Math and Statistics Solutions

 A∪ B b) A#772; c #4103")


