The following 2 boxplots depict data that was collected for bone density (g/square cm) for both male
Question: The following 2 boxplots depict data that was collected for bone density (g/square cm) for both male and female.
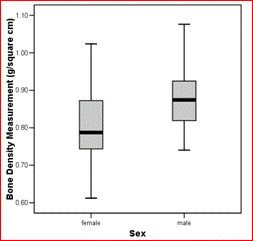
Use the boxplots to answer the questions that follow.
a. Which sex tends to have a higher bone density? How can you tell?
b. Which boxplot more-so represents data that is right-skewed? How can you tell?
c. Which boxplot has a greater range of possible values between Q2 and Q3? How can you tell?
d. Estimate the IQR for male. Approximately what percent of values lie within the IQR?
Price: $2.99
Solution: The solution consists of 1 page
Solution Format: Word Document
Solution Format: Word Document
-
 [Solution] The following 2 scatterplots, denoted as Scatterplot A and Scatterplot B, depict data collected on 1 #26616
-
[Solved] Weights of 120 boys: 30 57 40 46 78 59 34 46 #12193
-
[Solution] Cameron is an investor trying to decide among the following three different investment opt #22082
-
[Solution] The table below shows the amount of expenditures and the amount of sales for a company f #13835
-
Math Solutions
-
Math Solutions


