The following 2 scatterplots, denoted as Scatterplot A and Scatterplot B, depict data collected on 1
Question: The following 2 scatterplots, denoted as Scatterplot A and Scatterplot B, depict data collected on 10 paired observations for automobile weight (pounds) and miles per gallon (mpg). They are scaled exactly the same. Answer the questions that follow.
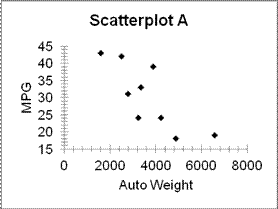
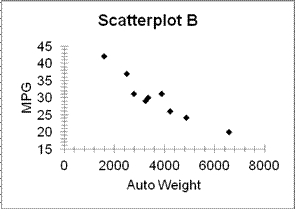
(a) One scatterplot has an r-value of -0.79 and the other scatterplot has an r-value of -0.93. Which one is which? How can you tell?
(b) By looking at the 2 scatterplots, does automobile weight appear to be a good predictor of miles per gallon? How can you tell? What type of correlation is represented in the 2 scatterplots: positive, negative, or neither?
Price: $2.99
Solution: The solution consists of 1 page
Deliverables: Word Document
Deliverables: Word Document
-
 [Solved] The parking manager for the Los Angeles Dodgers baseball team has studied the exit times for cars le #26617
-
[Solution] If you reject the null hypothesis based on sample data, does this ABSOLUTELY AND I MEAN ABSOLUTELY m #29025
-
(See Solution) Thirteen students entered an undergraduate business program two years ago. The following table indic #26707
-
Solution: The file “Question 3 Data” contains two columns MacDonald and SP Index which contain the monthly ret #1071
-
Math Help
-
Math Solved Problems


 Thirteen students entered an undergraduate business program two years ago. The following table indic #26707")


