The following three scenarios are each based on the IQ scores and the SAT Math scores for 26 12th-gr
Question: The following three scenarios are each based on the IQ scores and the SAT Math scores for 26 12th-graders. For each scenario I have regressed SATM scores on IQ and have provided the relevant scatterplot, the studentized deleted residuals, the leverages and the Cook’s distances. In each of the three scenarios, there is one observation that stands apart from the others in some way.
For each of the three scenarios:
(a) Identify (in terms of IQ and SATM scores) from the scatterplot, the way in which the observation differs from the others.
(b Indicate which 12th-grader you identified in part (a) and how the values of these three diagnostic measures for the observations you identified in part (a) correspond to the descriptions you gave there.
(c) Predict how the slope of the least-squares regression line would change (increase in value, stay roughly the same, or decrease in value) if the observation you identified in part (a) was not included in the data set
Scenario 1
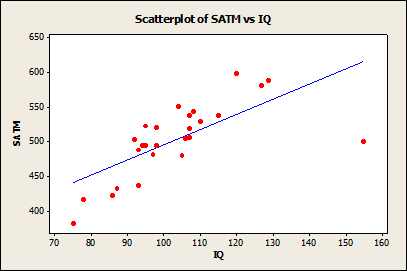
12G IQ SATM SDR Lev COOK
1 107 518 0.18085 0.040589 0.00072
2 107 538 0.70446 0.040589 0.01072
3 94 494 0.29742 0.050173 0.00243
4 107 506 -0.12908 0.040589 0.00037
5 106 504 -0.12416 0.039634 0.00033
6 104 550 1.21185 0.038572 0.02890
7 120 599 1.66020 0.078645 0.10961
8 92 503 0.65173 0.055876 0.01288
9 87 432 -0.94432 0.075067 0.03635
10 127 581 0.71474 0.118871 0.03518
11 110 530 0.32255 0.045142 0.00255
12 78 417 -0.83953 0.127371 0.05208
13 97 482 -0.18425 0.043733 0.00081
14 115 538 0.24784 0.058370 0.00198
15 98 494 0.06953 0.042150 0.00011
16 93 437 -1.15919 0.052884 0.03698
17 75 382 -1.71832 0.149880 0.24070
18 155 500 -6.43111 0.417904 5.53636
19 105 480 -0.69379 0.038962 0.00997
20 108 544 0.80709 0.041825 0.01443
21 93 488 0.19840 0.052884 0.00114
22 95 495 0.26610 0.047745 0.00185
23 129 588 0.79458 0.132901 0.04914
24 98 520 0.75022 0.042150 0.01261
25 86 422 -1.16795 0.079751 0.05823
26 95 523 1.01304 0.047745 0.02570
Scenario 2
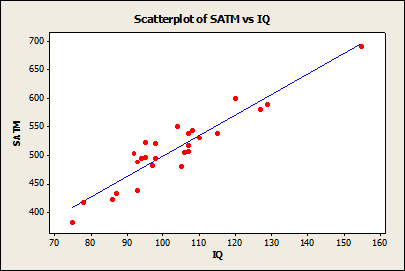
12G IQ SATM SDR Lev COOK
1 95 495 0.62038 0.047745 0.009902
2 75 382 -1.29107 0.149880 0.142965
3 107 506 -0.77280 0.040589 0.012849
4 110 530 -0.19177 0.045142 0.000906
5 95 523 1.97531 0.047745 0.087265
6 104 550 1.69014 0.038572 0.053188
7 97 482 -0.25639 0.043733 0.001564
8 107 518 -0.24614 0.040589 0.001334
9 155 690 -0.30010 0.417904 0.033603
10 87 432 -0.90023 0.075067 0.033148
11 108 544 0.72925 0.041825 0.011838
12 92 503 1.50006 0.055876 0.063290
13 93 488 0.62897 0.052884 0.011330
14 86 422 -1.20606 0.079751 0.061857
15 115 538 -0.62835 0.058370 0.012554
16 127 581 -0.64659 0.118871 0.028902
17 105 480 -1.66604 0.038962 0.052389
18 106 504 -0.70205 0.039634 0.010390
19 107 538 0.62124 0.040589 0.008378
20 129 588 -0.65910 0.132901 0.034095
21 98 520 1.27129 0.042150 0.034670
22 93 437 -1.68347 0.052884 0.073506
23 98 494 0.10749 0.042150 0.000265
24 78 417 -0.13394 0.127371 0.001365
25 94 494 0.73619 0.050173 0.014593
26 120 599 1.31271 0.078645 0.071394
Scenario 3

12G IQ SATM SDR Lev COOK
1 104 550 0.62918 0.040764 0.008629
2 127 581 -0.42118 0.196823 0.022507
3 115 538 -0.43888 0.084841 0.009239
4 107 518 -0.27316 0.047229 0.001924
5 105 480 -0.95170 0.042456 0.020159
6 87 432 -0.66839 0.082847 0.020653
7 95 523 0.71272 0.046374 0.012610
8 129 588 -0.42391 0.221969 0.026541
9 95 495 0.10961 0.046374 0.000305
10 108 544 0.20829 0.050310 0.001197
11 75 382 -0.93154 0.193119 0.104421
12 110 530 -0.23696 0.057861 0.001795
13 98 494 -0.12913 0.040337 0.000365
14 78 417 -0.33602 0.159300 0.011108
15 106 504 -0.49992 0.044611 0.006023
16 107 538 0.15283 0.047229 0.000603
17 96 690 8.50980 0.043899 0.418161
18 93 437 -1.00303 0.052714 0.027985
19 120 599 0.53091 0.123397 0.020451
20 94 494 0.16127 0.049313 0.000703
21 93 488 0.10633 0.052714 0.000328
22 107 506 -0.53123 0.047229 0.007210
23 98 520 0.42368 0.040337 0.003906
24 97 482 -0.31198 0.041886 0.002211
25 92 503 0.50294 0.056579 0.007828
26 86 422 -0.81942 0.089489 0.033454
Type of Deliverable: Word Document

-
 [Solved] Write the formula for an odds ratio and interpret in words exactly what the ratio tells us about the #27213
-
[Solved] Back injuries at work . A poll by the Gallup Organization sponsored by Philadelphia-based CIGNA Inte #8257
-
Solution: For borrowers with good credit scores, the mean debt for revolving and installment accounts is $15,0 #27150
-
[Solved] Use the RENAL.sav file from Norusis and do the following: One Sample t-test - Using "Length of Sta #15287
-
Math Help
-
Step-by-Step Math Solutions


