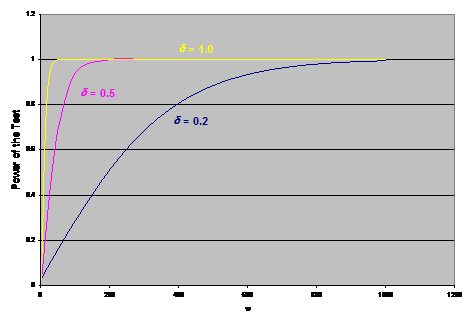
Below is a graph of three power curves as a function of n, the degrees of freedom, for three d value
Question: Below is a graph of three power curves as a function of n, the degrees of freedom, for three d values: 0.2, 0.5 and 1.0. Again the standard deviation for both populations is s = 1.0 . Explain why the curves become increasingly steeper as d increases. The curves are asymptote at 1 for large n. Why?
Price: $2.99
Answer: The solution consists of 2 pages
Type of Deliverable: Word Document
Type of Deliverable: Word Document
-
 [Solution] The table below contains data on fat absorption by donuts in the process of cooking. Each cell is th #7253
-
Solution: The NAEP (National Assessment of Educational Progress) includes a short test of quantitative skills #22467
-
Solution: Since muscle tension in the head region has been associated with tension headaches, you reason that #11631
-
(Solved) Let X_1,...,X_n be i.i.d. observations from a Gamma(1, μ ), and Y_1,...,{Y_m} be i.i. #25386
-
Math Homework Help
-
Step-by-Step Math Solutions

 includes a short test of quantitative skills #22467")

 Let X_1,...,X_n be i.i.d. observations from a Gamma(1, μ ), and Y_1,...,{Y_m} be i.i. #25386")

