Power curves for two-sample test. a. (5 points). Below is a graph of three power curves as a funct
Question: (10 points) Power curves for two-sample test.
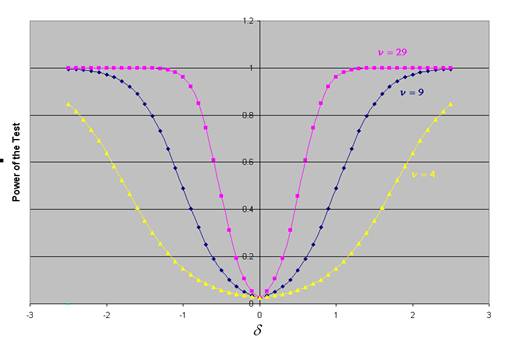
a. (5 points). Below is a graph of three power curves as a function of d, the true difference between the means in the two samples. The standard deviations of both populations are s = 1. Hence, think of d as being in standard deviation units. The curves are for 29, 9 and 4 degrees of freedom. Give a reason why the valley in the middle becomes increasingly steeper and narrower as the degrees of freedom increases.
Price: $2.99
Solution: The downloadable solution consists of 2 pages
Deliverables: Word Document
Deliverables: Word Document
-
 [Solved] Below is a graph of three power curves as a function of n, the degrees of freedom, for three d value #7252
-
(See Solution) Salaries of actuaries: Nationwide the average salary of actuaries who achieved the rank of fellow is #22510
-
[Solution] A sociologist wants information on the number of children per family in her native state of Nebraska #13415
-
[Solved] What is the difference between a sample and a population? #15183
-
Math and Statistics Calculator
-
Math and Statistics Solutions

 Salaries of actuaries: Nationwide the average salary of actuaries who achieved the rank of fellow is #22510")


