In March 2000 the bureau of Labor Statistics recorded the incomes of 55,899 people as a population p
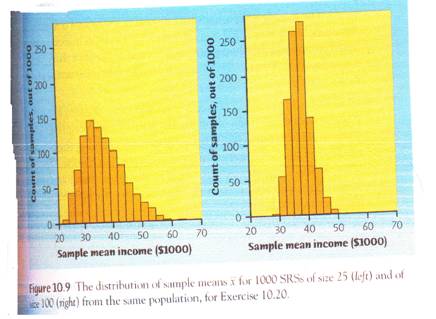
Question: In March 2000 the bureau of Labor Statistics recorded the incomes of 55,899 people as a population people between the ages of 25 and 65 who had worked but whose main work was not in agriculture. We will treat these 55,899 people as a population. As is usually the case, the distribution of incomes in this population is strongly skewed to the right. To estimate the mean income in this population, we can select an SRS and use the sample mean (x) to estimate the unknown population mean. How will the sample mean behave when we take many samples?
We used software to choose 1000SRSs of size 25 and another 1000 SRSs of size 100. Figure 10.9 shows histograms of the two sets of 1000 sample means, using the same classes and drawn to the same scale for easy comparison.
a. Which distribution is closer in shape to the bell curve of a Normal distribution? What important fact about sampling distributions does this comparison illustrate?
b. About what is the range (from smallest to largest) of the sample means for samples of size 25? For samples of size 100? What important fact about sampling distributions does this comparison illustrate?
c. Based on the sample means for samples of size 100, about what is the value of the mean income for this entire population?
Deliverables: Word Document

-
 A laboratory weighs filters from a coal mine to measure the amount of dust in the mine atmosphere. R #6011") (See Solution) A laboratory weighs filters from a coal mine to measure the amount of dust in the mine atmosphere. R #6011
(See Solution) A laboratory weighs filters from a coal mine to measure the amount of dust in the mine atmosphere. R #6011
-
[Solution] The CEO of Exploitron, Inc. wants to know the mean and standard deviation for the number of sick day #7763
-
[Solved] Find the 90% confidence interval for the variance and standard deviation for the price in dollars of #8815
-
[Solution] In low-speed crash tests of five SMART cars, the repair costs were computed for a factory-authorized #29036
-
Math Homework Help
-
Step-by-Step Math Solutions
 A laboratory weighs filters from a coal mine to measure the amount of dust in the mine atmosphere. R #6011")


