The city has asked schools to test water in their drinking taps for levels of lead. Below is a table
Question: The city has asked schools to test water in their drinking taps for levels of lead. Below is a table of lead levels based on random sampling conducted in fours schools (measured in parts per billion). An ANOVA analysis was performed on the data.
| School A | School B | School C | School D |
| 5.9 | 6.3 | 4.8 | 6.0 |
| 6.1 | 6.6 | 4.3 | 6.2 |
| 6.3 | 6.4 | 5.0 | 6.1 |
| 6.1 | 6.4 | 4.7 | 5.8 |
| 6.0 | 6.5 | 5.1 |
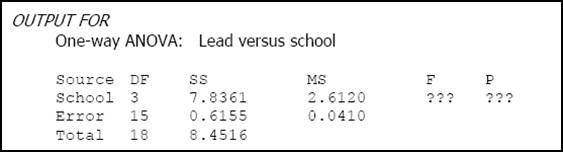
a) Use the values from the ANOVA output above to determine if the data provide sufficient evidence to indicate a difference in mean levels of lead between the schools. Show your hypotheses. You will need to determine the missing values for the ANOVA output (those things indicated by ???).
b) Compare the mean lead levels in School B and School C. Use a 95% confidence interval.
Price: $2.99
See Answer: The downloadable solution consists of 3 pages
Deliverables: Word Document
Deliverables: Word Document
-
 [Solution] An airline wishes to assess the amount of money spent on duty free purchases on an international fli #2865
-
(Solved) The table below lists the result of a (fictional) poll to determine the preferred source of televisi #17591
-
(Solved) Assume that the average annual salary for a worker in the United States is $31,000 and that the annu #16481
-
[Solution] For a sample of n = 9 patients, the scores for 7-Minute Screen averaged M = 7 with SS = 92. The cogn #21643
-
Math and Statistics Calculator
-
Math Solutions

 The table below lists the result of a (fictional) poll to determine the preferred source of televisi #17591")
 Assume that the average annual salary for a worker in the United States is $31,000 and that the annu #16481")


