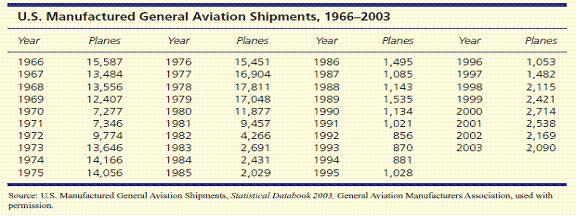
(a) Plot the data on U.S. general aviation shipments. (b) Describe the pattern and discuss possible
Question: (a) Plot the data on U.S. general aviation shipments. (b) Describe the pattern and discuss possible causes. (c) Would a fitted trend be helpful? Explain. (d) Make a similar graph for 1992–2003 only. Would a fitted trend be helpful in making a prediction for 2004? (e) Fit a trend model of your choice to the 1992–2003 data. (f) Make a forecast for 2004, using either the fitted trend model or a judgment forecast. Why is it best to ignore earlier years in this data set? Airplanes
Price: $2.99
Solution: The solution file consists of 5 pages
Solution Format: Word Document
Solution Format: Word Document
-
 [Solved] A sample of 20 pages was taken without replacement from the 1,591-page phone directory Ameritech #26580
-
(See Solution) A statistical analysis of 1,000 long-distance telephone calls made from the headquarters of the B #15098
-
[Solution] Find the probabilities for each, using the standard normal distribution P (z < - 2.34) #18427
-
(See Solution) Morality Study: for a group of four men, the probability distribution for the number x who live thro #14132
-
Math Help
-
Math Solved Problems

 A statistical analysis of 1,000 long-distance telephone calls made from the headquarters of the B #15098")
 #18427")
 Morality Study: for a group of four men, the probability distribution for the number x who live thro #14132")

