Use SPSS to solve Data analysis Problem 1 in chapter 20. (Page 472 SPSS 16.0) Use assignment 11bc tu
Question: Use SPSS to solve Data analysis Problem 1 in chapter 20. (Page 472 SPSS 16.0) Use assignment 11bc tutorial
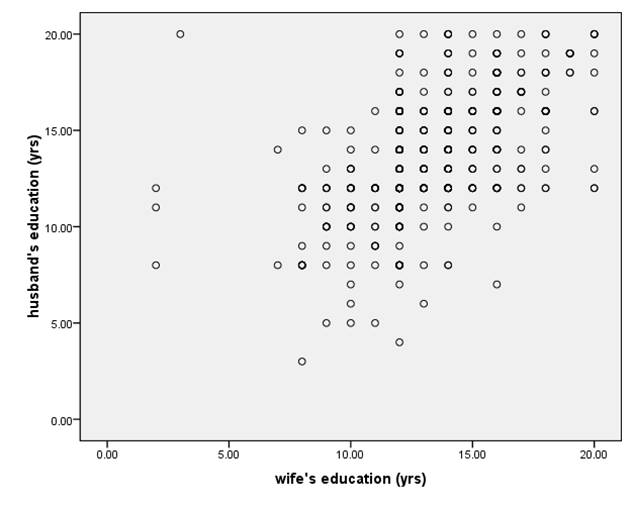
Using the Graphs menu, make a scatter plot of husband’s education against wife’s education (variables husbeduc and wifeduc). Edit the chart to draw the regression line and print R2.
a. Does there appear to be a linear relationship between the two variables?
b. Would you characterize the relationship as positive or negative?
c. From the plot, estimate the slope and the intercept. (It is easier to estimate the intercept if you edit the x-axis to start at 0.)
d. What is the value for the correlation coefficient?
e. Describe the points that are far from the regression line.
Graph
Price: $2.99
Solution: The downloadable solution consists of 4 pages
Deliverables: Word Document
Deliverables: Word Document
-
 Use SPSS to solve Data analysis Problem 2 a, b in chapter 20. (page 472 SPSS 16.0) Use assignment 11 #15820") (Solved) Use SPSS to solve Data analysis Problem 2 a, b in chapter 20. (page 472 SPSS 16.0) Use assignment 11 #15820
(Solved) Use SPSS to solve Data analysis Problem 2 a, b in chapter 20. (page 472 SPSS 16.0) Use assignment 11 #15820
-
[Solved] A bank discrimination case has been filed regarding salary to race. The bank has 1,745 hourly worker #15203
-
[Solved] Roger has read a report that the weights of adult mail Siberian tigers have a distributi #5418
-
(See Solution) Scores on a motor-performance test for employees who hold non-sedentary jobs (Group 1) are norma #21315
-
Free Math Help
-
Math and Statistics Solutions
 Use SPSS to solve Data analysis Problem 2 a, b in chapter 20. (page 472 SPSS 16.0) Use assignment 11 #15820")


 Scores on a motor-performance test for employees who hold non-sedentary jobs (Group 1) are norma #21315")

