Solution) Below is the life expectancy for an individual born in the United States in certain years. a. Decid
Question: Below is the life expectancy for an individual born in the United States in certain years.
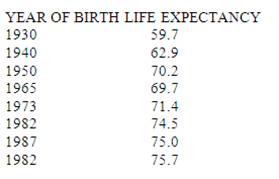
a. Decide which variable should be the independent variable and which should be the dependent variable.
b. Draw a scatter plot of the ordered pairs.
c. Calculate the least squares line. Put the equation in the form of: Y= a + bx
d. Find the correlation coefficient. Is it significant?
e. Find the estimated life expectancy for an individual born in 1950 and for one born in \(1982\).
f. Why aren’t the answers to part (e) the values on the above chart that correspond to those years?
g. Use the two points in (e) to plot the least squares line on your graph from (b)
h. Based on the above data, is there a linear relationship between the year of birth and life expectancy?
i. Are there any outliers in the above data?
j. Using the least squares line give an accurate estimate for that year? Explain why or why not.
Deliverables: Word Document

-
 [Solution] Three professors at George Washington University did an experiment to determine if economists are mo #12311
-
[Solution] Managers at all levels of an organization need adequate information to perform their respective task #19
-
(Solved) Considering what you have learned about the measures of central tendency, what is the most appropria #11564
-
[Solution] A mutual fund calculates its annualized total return at the end of every business day. Over a 10-yea #19530
-
Math Help
-
Step-by-Step Math Solutions


 Considering what you have learned about the measures of central tendency, what is the most appropria #11564")


