Consider the following joint frequency table which summarizes voting trends in the most recent Presi
Question: Consider the following joint frequency table which summarizes voting trends in the most recent Presidential election.
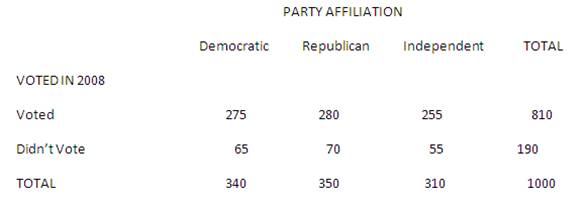
a) Convert the table above to a joint probability table (15 points).
Use your table in part a) to find the following probabilities.
b) That a survey subject’s party affiliation is Republican (3 points).
c) That a survey subject did not vote in the 2008 Presidential election (3 points).
d) That a survey subject’s party affiliation is Republican and that she or he did not vote in the 2008 Presidential election (3 points).
e) That a survey subject’s party affiliation is Republican or that she or he did not vote in the 2008 Presidential election (5 points).
f) Suppose it is known that a survey subject’s party affiliation is Republican. What is the probability that she or he did not vote in the 2008 Presidential election (5 points).
g) What is the probability that two randomly selected survey subjects did not vote in the 2008 Presidential election. (Hint: This is an “and” probability. Assume independence) (5 points).
Deliverables: Word Document

-
 [Solution] A retailer sells books and music in a brick and mortar store and through a web site. 53% of the sale #18591
-
[Solution] A student is taking two courses, history and math. The probability the student will pass the history #26160
-
[Solution] In how many ways can 9 instructors be assigned to seven sections of a course in mathematics? #25460
-
[Solution] Suppose you are standing along an isolated country road (with obviously nothing else better to do) #7050
-
Math and Statistics Calculator
-
Math and Statistics Answers


 #7050")

