The data shown (in part) below refers to the deviations (x) from nominal diameter for drilled holes
Question: The data shown (in part) below refers to the deviations (x) from nominal diameter for drilled holes (in inches´10-4). The sample size = 5.
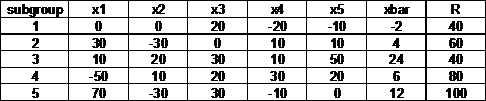
a. [5 points] Make x-bar & R charts of this data, including the UCL and LCL control limits for both xavg and R.[1]
b. [5 points] Are any points out of control (OOC), i.e., outside the UCL and/or LCL?
[1] To do this, use the blank ASQ control chart form shown on the zip file for chapter 16. Note that you can copy/paste the form to Word, etc. The same chart should be used for all other problems involving x-bar & R charts. You can also print the ASQ form in the chapter 16 PowerPoint file. You can also use the control chart algorithms in Statgraphics/Centurion.
Price: $2.99
Solution: The downloadable solution consists of 1 page
Deliverables: Word Document
Deliverables: Word Document
-
 below gives the percentage of household wealth held by the top 1% income ea #24795") [Solution] The data shown (in part) below gives the percentage of household wealth held by the top 1% income ea #24795
[Solution] The data shown (in part) below gives the percentage of household wealth held by the top 1% income ea #24795
-
(See Solution) Avoiding a collision. A car is traveling on a road that is perpendicular to a railroad track. When t #14919
-
Solution: Social science. Gasoline accounts for 85% of the motor fuel consumed in the United States every day. #6370
-
Solution: Develop a seasonally adjusted forecast model for order data. Forecast demand for each quarter for 20 #3070
-
Math and Statistics Calculator
-
Step-by-Step Math Solutions
 below gives the percentage of household wealth held by the top 1% income ea #24795")
 Avoiding a collision. A car is traveling on a road that is perpendicular to a railroad track. When t #14919")


