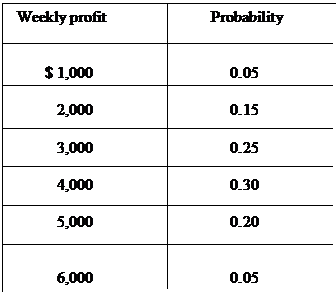
The table below shows the probability distributions for weekly profit at two restaurants at differen
Question: The table below shows the probability distributions for weekly profit at two restaurants at different location.
Location at A:
|
Location at B:
The table below shows the manager’s utility function.
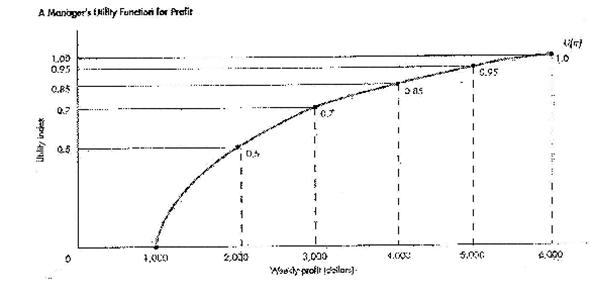
i. Calculate the expected utilities for the restaurants at the two different locations.
ii. Hence, based on the maximization of expected utility, state which is a better location for the restaurant.
Price: $2.99
Solution: The solution file consists of 2 pages
Deliverables: Word Document
Deliverables: Word Document
-
 [Solution] The table below show the Present value and the present value of several projects #18968
-
[Solved] The chemical retardants are freight shipped from a warehouse. A shipping crate that weights 450 kilo #5683
-
(See Solution) You are in charge of creating a control chart for your new process. You take 25 samples of n=4 each. #23291
-
(See Solution) Graph the following LP problem and indicate optimal solution point max 3x+2y #13087
-
Math Help
-
Math Solved Problems


 You are in charge of creating a control chart for your new process. You take 25 samples of n=4 each. #23291")
 Graph the following LP problem and indicate optimal solution point max 3x+2y #13087")

