You are creating an xbar and R chart to monitor your process. You measure 4 randomly selected items
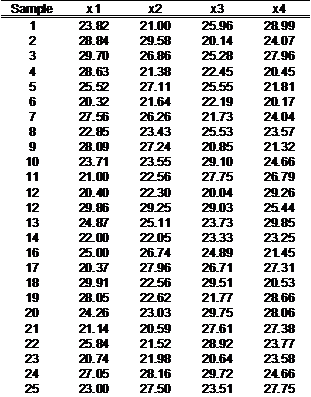
Question: You are creating an xbar and R chart to monitor your process. You measure 4 randomly selected items from each batch you make. Use the following data from 25 samples to make the charts and answer the following questions:
a. What are the control limits of each chart? Use the range method to estimate ?. Show your calculations.
b. Does your process appear to be in control? If so, are you ready to go to Phase II? Justify your answer.
c. You go to Phase II. Over time you collect data from new samples and add them to the chart. Add the following data to the chart established in Phase I and show the chart. Is the process still in control? If so, describe what has happened. What do you recommend?

Price: $2.99
Solution: The answer consists of 8 pages
Deliverables: Word Document
Deliverables: Word Document
-
 [Solution] Consider the following linear program: Maximize: Z = 60A + 50B Subject to: 10A + 20B <= (less than o #17101
-
(Solved) Project Management Jean Walker is making plans for spring break at the beaches in Florida. In apply #12937
-
[Solved] Coase Farm grows soybeans near property owned by Taggat Railroad. Taggat can build zero one or two r #22247
-
(See Solution) Calculate the market potential for sales of special optical scanning systems. For each million in sa #7511
-
Free Math Help
-
Math Solved Problems

 Project Management Jean Walker is making plans for spring break at the beaches in Florida. In apply #12937")

 Calculate the market potential for sales of special optical scanning systems. For each million in sa #7511")

