The graph shown below relates the state of health to the socio economic status of families in three
Question: The graph shown below relates the state of health to the socio economic status of families in three counties. Both health and socio-economic status are measured by indices where higher numbers indicate a higher level of the concept underlying the index
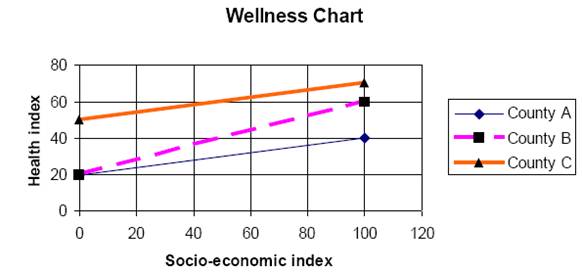
a. Comment on the specific values of the two indices in this data set based on what we said about index numbers in class.
b. The following statement accompanies the graph: “Growth in the health index is observed as socio-economic levels increase”. Compare the growths of the three counties shown in the chart.
c. For each of the three counties, write an expression (equation) to reflect the linear relationships between the two indices shown in the graph.
d. For each of the three counties, state what the health index would be for a socio-economic index level of 60. Explain how you arrived at your answers.
Deliverables: Word Document

-
 You have the option of paying off a standard loan (e.g. mortgage) with either equal sized quarterly #15570") (Solved) You have the option of paying off a standard loan (e.g. mortgage) with either equal sized quarterly #15570
(Solved) You have the option of paying off a standard loan (e.g. mortgage) with either equal sized quarterly #15570
-
(Solved) Describe at least 3 ways in which statistical distortion could occur and statistics could be misused #25671
-
(See Solution) Avoiding a collision. A car is traveling on a road that is perpendicular to a railroad track. When t #14919
-
[Solved] A Trucking company has just purchased 30 additional trucks for each of three warehouses (Charlotte #14890
-
Math Homework Help
-
Step-by-Step Math Solutions
 You have the option of paying off a standard loan (e.g. mortgage) with either equal sized quarterly #15570")
 Describe at least 3 ways in which statistical distortion could occur and statistics could be misused #25671")
 Avoiding a collision. A car is traveling on a road that is perpendicular to a railroad track. When t #14919")


