The following table shows the number of applicants accepted and refused by different graduate progra
Question: The following table shows the number of applicants accepted and refused by different graduate programs of a big university. The table shows the name of the program, the gender of the applicant, and the decision on the application.
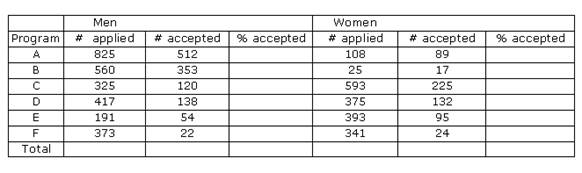
a) Fill the blank columns of the above table.
b) If you look at each program, who is being admitted in higher percentage, men or women?
c) If you look at the acceptance rate overall, who is being admitted in higher percentage, men or women?
d) State clearly, a reason as to why do we have opposite answers in the parts b) and c.)
Price: $2.99
Answer: The solution consists of 2 pages
Deliverables: Word Document
Deliverables: Word Document
-
 Compute C8,3 #1243") (See Solution) Compute C8,3 #1243
(See Solution) Compute C8,3 #1243
-
Solution: The Ortegas decide to buy some furniture priced at $400 with $40 down and the balance to paid for us #7527
-
[Solution] Time of flight- Use the information from exercise 115 (see below) to determine how long Johnson air. #6921
-
[Solved] Management of High Tech Services (HTS) would like to develop a model that will help allocate their t #26789
-
Free Math Help
-
Math Solved Problems
 Compute C8,3 #1243")

 to determine how long Johnson air. #6921")
 would like to develop a model that will help allocate their t #26789")

